
|
Novarum DX Ltd
|
Document ID: IFU042
|
Use Performance Reports to create, view, export and interpret assay performance evidence in the RARE web portal. Reports now include the original pooled diagnostic and analytical sections plus population accounting, phone-to-phone variability, phone-effect margin comparisons, environmental capture robustness and temporal usability outputs.
Performance Reports Management
The Performance Reports Management page is the Data Analysis entry point for generated Performance Reports in the RARE portal. It helps LF manufacturing, quality and laboratory science users review how an assay configuration performs against known reference data, and provides the audit trail needed to understand exactly which dataset, classifier, batch configuration, software version and report configuration produced a given result.
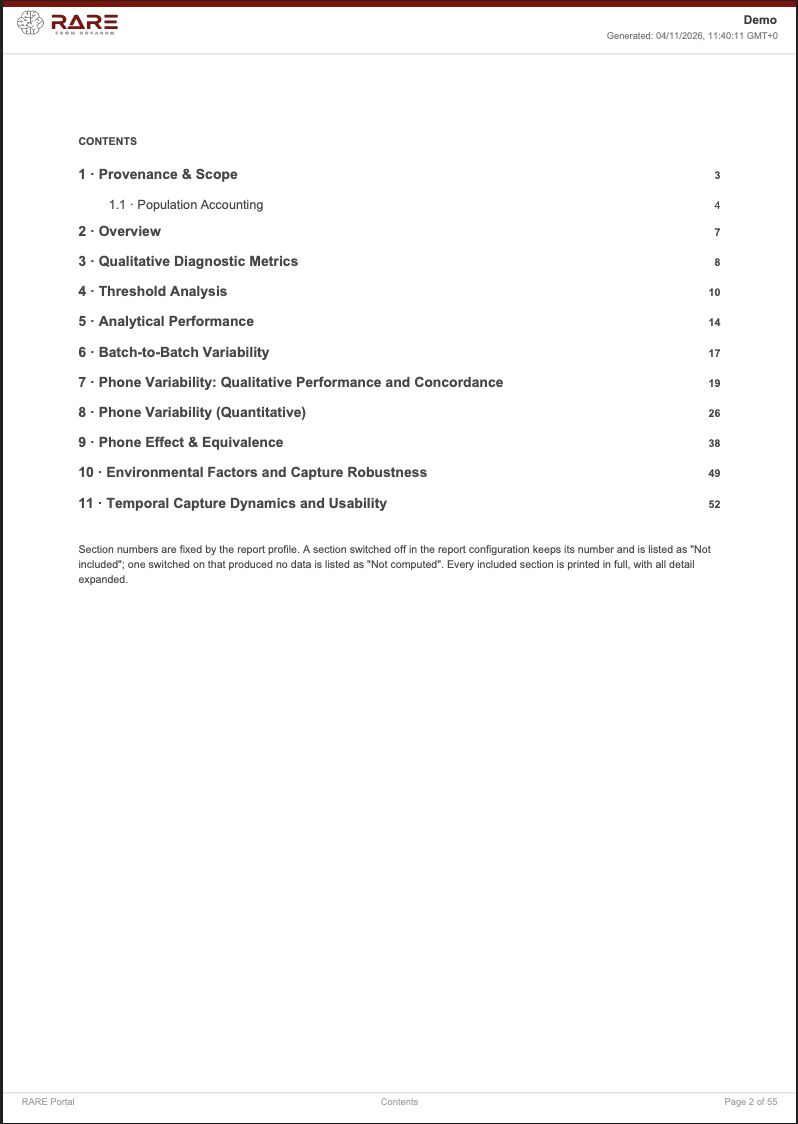
The generated report layout uses a fixed 11-section structure. Sections that are switched off keep their section number in the contents, while included sections are printed in full.

Why use Performance Reports?
A Performance Report acts as a snapshot in time. It records how a specific dataset performed with a specific version of the qualitative classifier, quantitative batch configuration and report settings.
This is useful for:
-
Method validation and design history evidence: capturing the diagnostic and analytical metrics used to support performance claims.
-
Configuration tuning: comparing thresholds, classifiers, calibration curves and report limits before fixing an operating configuration.
-
Manufacturing and QC review: checking lot-to-lot consistency, concentration-level precision and population balance across phone models or batches.
-
Device-matrix review: exploring whether supported phone models behave similarly or whether a phone-specific effect should be investigated further.
-
Data science follow-up: using exported tabular data to investigate outliers, sparse cells, environmental telemetry or concentration-level trends outside the report view.
Key concepts
-
Performance Report – A generated report view or PDF that summarises diagnostic, analytical, device, environmental and usability metrics for a selected dataset and configuration.
-
Dataset – The set of result records used as the report input. Report selectors exclude datacollector-mode datasets that are not compatible with Performance Reports.
-
Qualitative Classifier – The interpretation configuration used to convert measured signal into qualitative calls such as positive or negative.
-
Quantitative Batch Configuration – The calibration configuration used to convert measured signal into quantitative values or to fit standard curves.
-
Ground Truth – The reference label or concentration used to evaluate the report output. Qualitative sections compare classifier calls with ground-truth classes; quantitative sections compare signal or fitted values with known concentration levels.
-
Phone model – The device model recorded against the result. The Portal uses this to stratify diagnostic metrics, calibration behaviour, environmental associations and usability/capture dynamics.
-
Telemetry – Capture information such as lux, pitch, yaw and PMF story frame timing. The environmental and temporal sections use usable telemetry where available.
Managing reports
Accessing Performance Reports
Navigate to:
Sidebar → Data Analysis → Performance Reports
What you can see and do depends on your user role, organisation access and subscription level.
Understanding the report list
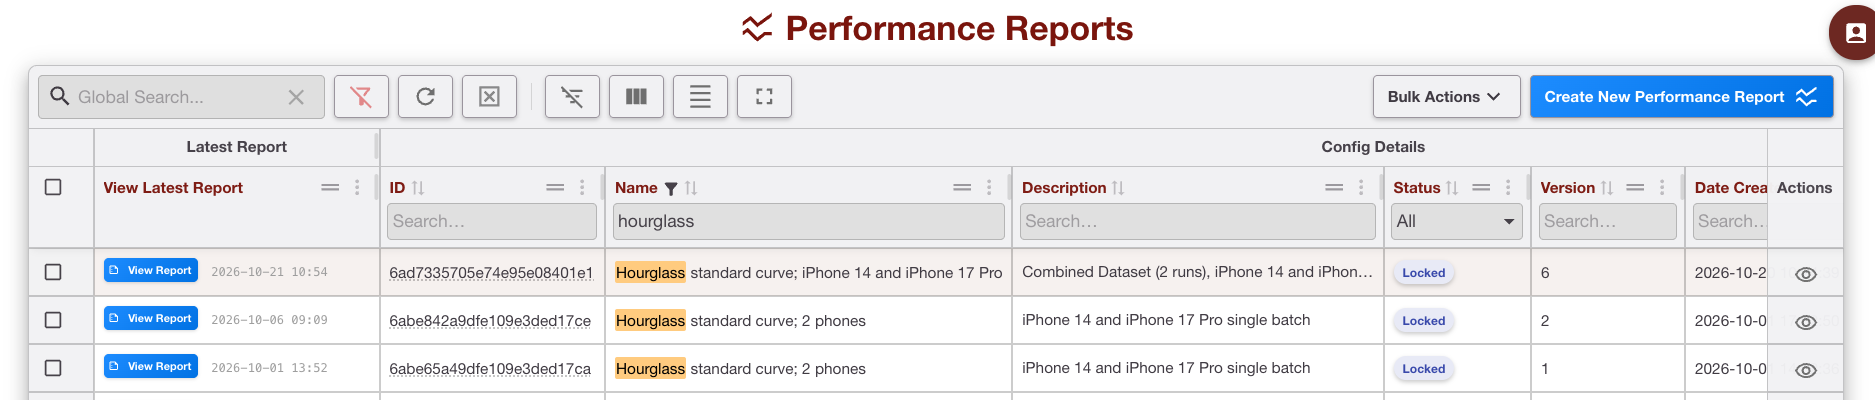
The report list provides an audit trail of generated and saved report configurations. Each row gives enough metadata to identify the report and reconstruct the analytical context. Depending on the current view, expect fields such as:
-
Report name or ID: the identifier used to find the analysis later.
-
Description: optional study context, for example the assay, run, validation purpose or device matrix.
-
Latest report status and timestamp: the most recent generation state and time.
-
Status: for example DRAFT for saved but not generated, LOCKED for generated at least once, or ARCHIVED for soft-deleted records.
-
Version: the report configuration version.
-
Created: the date and time the report configuration or generated report was created.
-
Organisation and user identifiers: useful for audit traceability.
-
Dataset identifiers: the dataset or combined dataset used for the analysis.
-
Classifier and batch configuration identifiers: the qualitative and quantitative configuration versions applied during generation.
Filtering and sorting reports
Use filters to find the report you need in a long audit history. Common filters include:
-
Report date: apply a from/to date range to limit the list to reports generated within a specific period.
-
Qualitative classifier: filter by interpretation configuration ID.
-
Quantitative batch: filter by batch or calibration configuration ID.
You can also sort by column headers, for example sorting by created date to bring the most recent analyses to the top.
Actions available
Each row includes an Actions control. You can:
-
Create New Performance Report: start a new report configuration from the page header.
-
View report configuration: inspect the saved settings, selected dataset, classifier, batch group, report sections, limits and version.
Bulk Actions also allow you to
-
Export to Excel or CSV: download the report list metadata for administrative review.
Creating a new Performance Report
Prerequisites
Before you begin, make sure you have:
-
An eligible interpreter reprocessing dataset: the dataset must contain finalised results generated using the relevant classifier and/or batch configuration.
-
Appropriate permissions: you must be allowed to create and generate reports for the organisation.
-
Ground truth: qualitative ground-truth classes and/or quantitative concentration levels must be present for the analyses you intend to run.
-
Compatible configurations: the dataset, classifier and batch configuration must be compatible. The portal uses a sequential report configuration flow so that downstream options update when an upstream choice changes.
-
Phone and telemetry coverage: phone variability sections require enough known phone-model data; environmental and temporal sections require usable capture telemetry.
Step 1 – Describe report
Give the report a clear name and description. Good names include the assay, dataset or study purpose, and any important device or batch scope.
-
Use a clear Name, for example Hourglass standard curve; iPhone 14 and iPhone 17 Pro.
-
Add a Description explaining why the report is being generated, for example validation, troubleshooting, QC lot comparison or phone-matrix review.

Use consistent naming conventions so that later readers can quickly distinguish validation, QC, investigation and regression reports.
Step 2 – Select dataset
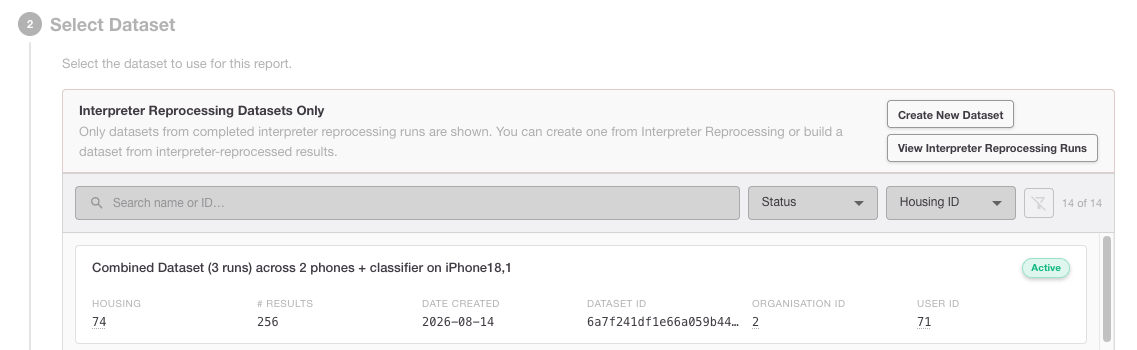
Choose the source dataset. We filter the report dataset selector to eligible non-datacollector-mode datasets and then load the classifier choices available for that dataset.
-
Review dataset identifiers, run descriptions, creation dates and result counts.
-
Select the dataset that matches the assay and study population you want to analyse.
-
If the dataset combines multiple runs or phones, check that this is intentional and documented in the report description.
Step 3 – Dataset overview
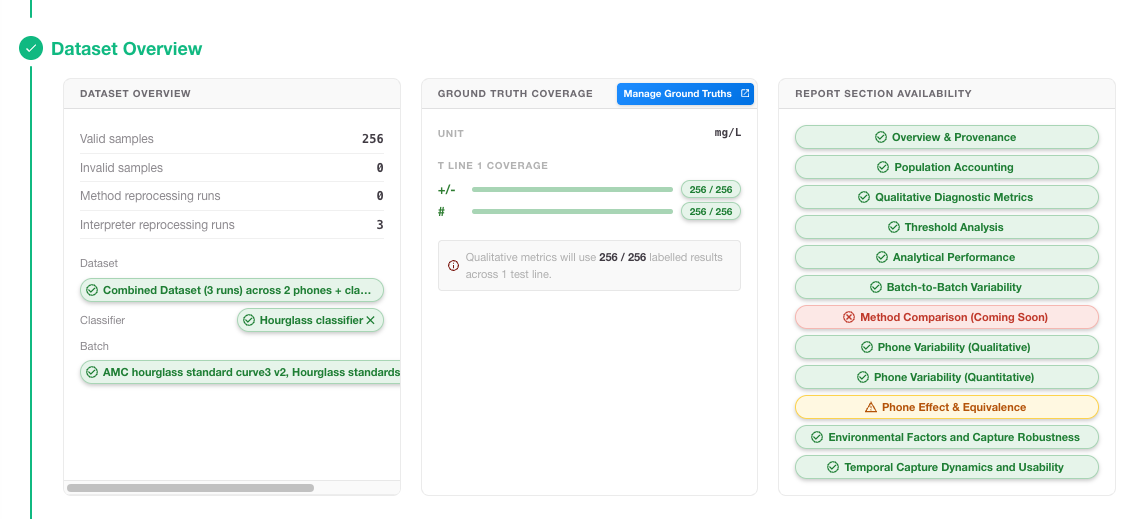
After you select the dataset, the dataset overview will show coverage and resport sections available. Confirm result counts, assay/test-line coverage, ground-truth availability and configuration compatibility.
-
Total results: check that the count matches the intended study population.
-
Phone model coverage: confirm whether results include one or multiple known phone models.
-
Verify the Configurations (Batch and Classifier) that were used to generate these results.
-
Ground truth: verify that the required qualitative classes and quantitative concentration levels are present.
Step 4 – Ground Truth Mapping
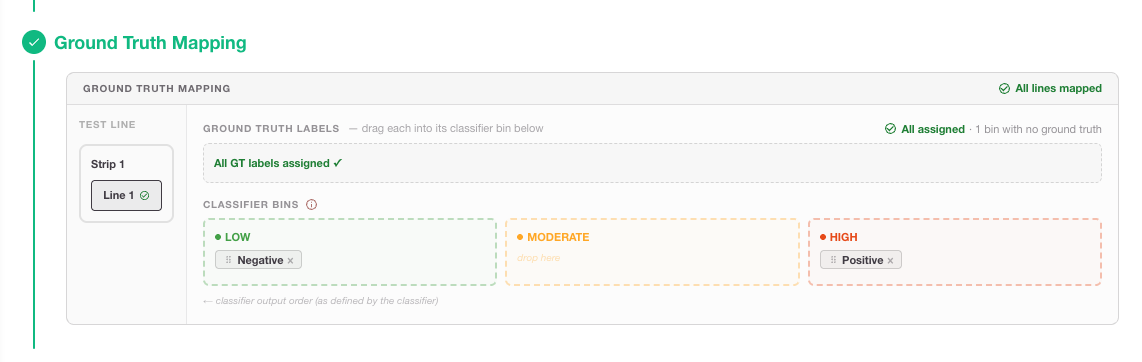
To calculate performance metrics like sensitivity and specificity, RARE needs to know which result labels correspond to your reference "Ground Truth." This mapping is flexible, allowing you to perform qualitative analysis on each specific threshold within your classifier.
Configuration Steps
-
Single strip, single test line: Map the interpreter's qualitative bins (e.g., "Positive", "Negative") to the Ground Truth categories.
-
Multiple strips / multiple test lines: For complex assays, ensure each test line is correctly mapped to its respective reference standard.
-
The system will validate that the mapping is complete before allowing you to move to the next step.
Mapping Multi-Bin Classifiers
If your classifier uses multiple bins (e.g., Low, Medium, and High), you can generate reports for different clinical scenarios by grouping these bins against your Ground Truth. This is achieved by mapping the thresholds between the bins:
-
Scenario A (Low vs. Others): You can map the first threshold so that Low is compared against a combined group of Medium + High.
-
Scenario B (High vs. Others): You can map the second threshold so that Low + Medium are grouped together and compared against High.
Step 5 – Choose report sections and limits
Customize your report by selecting the specific analysis modules you need. You can toggle these on or off based on your validation requirements:
|
Section |
Purpose |
Main question answered |
|---|---|---|
|
1 · Provenance & Scope |
Records report metadata, dataset, configuration versions and environment. |
What exactly was analysed, by whom, when and with which software/configuration versions? |
|
1.1 · Population Accounting |
Shows the data-quality funnel, missingness matrix and design-crossing matrix. |
Which records were captured, selected, valid and analysed, and where are the gaps? |
|
2 · Overview |
Summarises headline findings and module status. |
Which sections need attention before reading detailed tables? |
|
3 · Qualitative Diagnostic Metrics |
Reports pooled confusion matrices and diagnostic proportions. |
How well does the classifier match ground truth overall? |
|
4 · Threshold Analysis |
Shows ROC/AUC, threshold optimisation and decision plots. |
How would changing the operating threshold affect sensitivity and specificity? |
|
5 · Analytical Performance |
Reports standard-curve, LoD/LoQ, precision, bias and recovery outputs where applicable. |
How consistent and accurate is the quantitative response across concentration? |
|
6 · Batch-to-Batch Variability |
Compares calibration curves, parameters and residuals across batches. Set a reference batch selected for Analytical Performance. |
Do manufacturing lots behave similarly enough for the intended use? |
|
7 · Phone Variability: Qualitative Performance and Threshold Stability |
Stratifies qualitative metrics, ROC/AUC and Youden-optimal thresholds by phone model. |
Does qualitative classification performance differ between phone models? |
|
8 · Phone Variability (Quantitative) |
Fits phone-specific calibration models and reports concentration-level precision, residuals and variance components where estimable. |
Does quantitative signal or calibration behaviour vary by phone model? |
|
9 · Phone Effect & Equivalence |
Reports phone-model effect estimates, 95% confidence intervals and comparisons with saved margins. |
Are estimated phone effects within the configured numerical margins, and what evidence class is assigned? |
|
10 · Environmental Factors and Capture Robustness |
Explores lux, pitch and yaw associations with signal and precision. |
Do capture conditions show patterns that merit investigation? |
|
11 · Temporal Capture Dynamics and Usability |
Shows PMF story timing, frame state, orientation and lux over capture time. |
Were captures stable over time, and are there usability/capture dynamics to review? |
The Portal supports a presentation density setting, for example a compact executive/triage view or a fuller regulatory/DHR view with expanded tables and matrices.
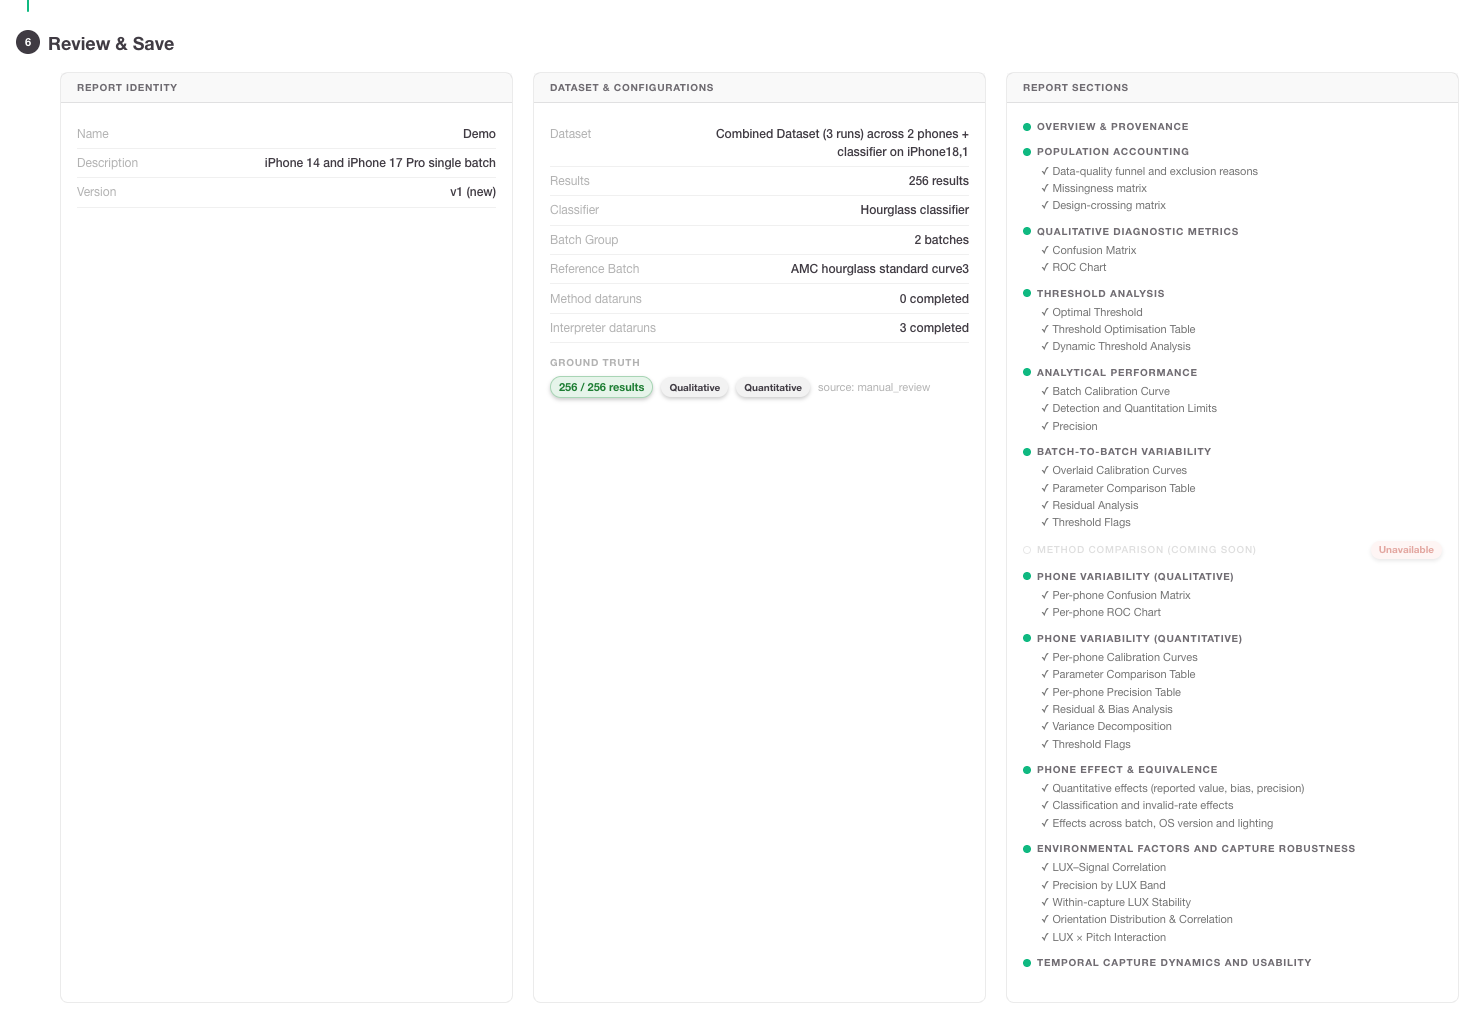
Step 6 – Review, save and generate
Review the configuration summary, then save and generate the report.
-
Check the report name, dataset, classifier, batch group, ground-truth mapping, selected sections, density and limits.
-
Click Save Configuration to store the settings and create a versioned configuration.
-
Click Generate Report to start the calculation engine.
-
For large datasets or reports with phone-specific fitting and temporal plots, allow additional processing time.
Interpreting a generated report
A generated report should be read from scope to conclusion:
first confirm what data was included, then review population completeness, then interpret each analytical module. Avoid reading a single chart without checking denominators, exclusions, unavailable states and section limitations.
Important interpretation rule: A visible plot or a green-looking status is not automatically a validation conclusion.
For phone variability sections, PASS/BREACH-style conclusions require explicit numerical limits configured before report generation. Environmental outputs are exploratory, and phone-effect equivalence outputs have specific limitations described below.
Report contents and PDF export
The PDF export is an expanded, paginated view of the generated report with running headers and a table of contents.
-
Use Export PDF from the report view to create an offline record for review, sharing or filing.
-
Sections switched off in the report configuration retain their number and are listed as not included.
-
Sections switched on but not computable report unavailable or not-estimable states rather than silently omitting the problem.
-
Temporal plots in PDF may reflect the active report view selection and may use reproducible sampling for dense frame data; check the reported counts and sampling disclosures.
Using exported XLS or other tabular exports for further analysis
When you need deeper analysis than the report view provides, export the underlying or summary tables where available. In a spreadsheet or statistics package, useful follow-up checks include:
-
Reconcile denominators: compare section-level counts with the population funnel and missingness matrix before drawing conclusions.
-
Filter by phone, batch and concentration: inspect whether apparent phone differences are really caused by uneven concentration or batch distribution.
-
Investigate sparse cells: treat phone × batch × concentration cells with fewer than three observations as exploratory, not definitive.
-
Plot residuals and CV by concentration: a global CV can hide concentration-specific instability near LoD or at the top of the range.
-
Review telemetry coverage: environmental conclusions are weak if lux/orientation data are missing for many records or concentrated in only one phone or batch.
-
Keep identifiers: retain report ID, dataset ID, result IDs, phone model, batch ID, classifier version and configuration version in any downstream workbook so that analyses remain traceable.
Report section guide
1 · Provenance & Scope
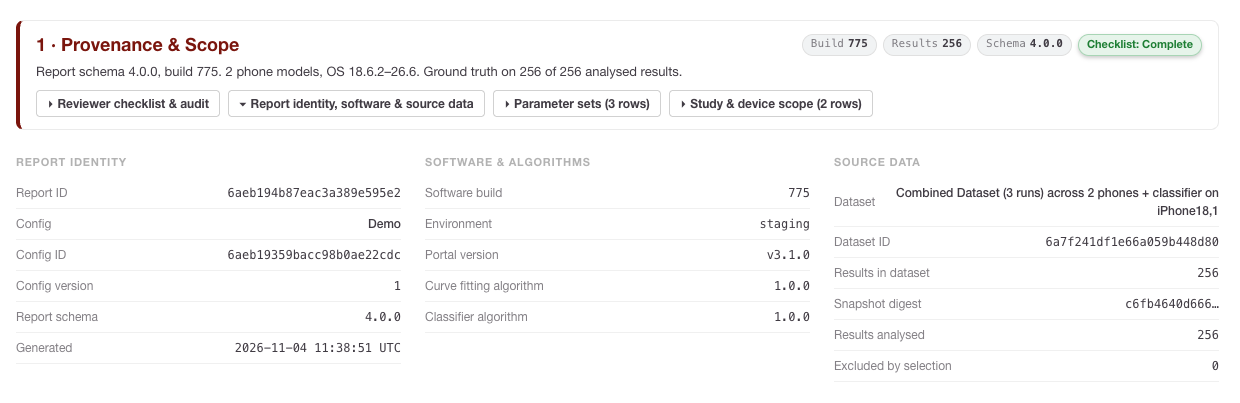
This section is the report’s technical passport. It records the organisation, generated-by user, generated-on timestamp, RARE Portal version, dataset scope, test-line scope, phone-model scope, profile/configuration identity and calculation timestamp.
Use it to answer:
-
Was the report generated in the expected environment, for example RARE Portal v3.1.0?
-
Does the dataset ID match the validation or QC study you intended to review?
-
Which phone models, test lines, classifier split and profile version were included?
-
Is the calculation timestamp appropriate, or could the dataset have changed between selection and generation?
1.1 · Population Accounting
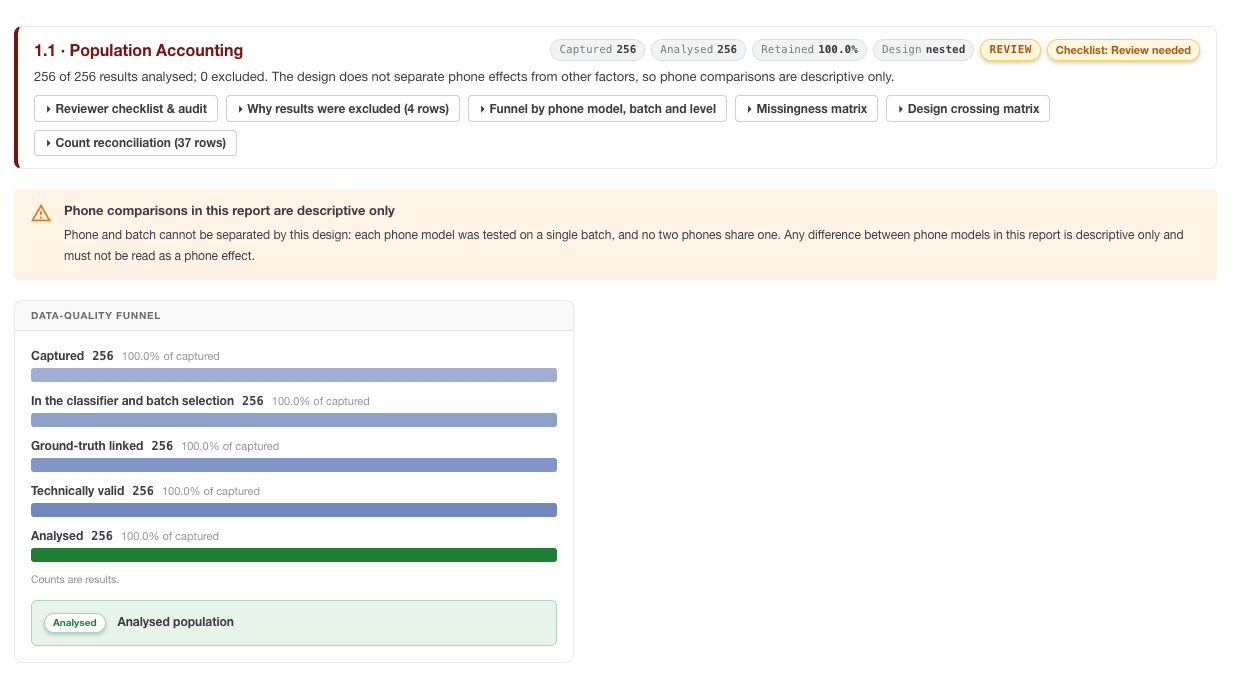
Population Accounting was added to make the analysed population auditable.
It includes:
-
Data-quality funnel: Captured → In the classifier and batch selection → Ground-truth linked → Technically valid → Analysed.
-
Exclusion reasons: selection exclusions, missing ground truth, invalid captures and missing analysis signal.
-
Missing result documents: represented separately as
not_found, not as an ordinary exclusion reason. -
Missingness matrix: missing counts, percentages and denominators for fields such as signals, ground truth, image, capture status, lux and orientation.
-
Design-crossing matrix: phone × batch × concentration or class counts, including zero-count cells and sparse-cell flags.
How to interpret it: Start here before reading any performance metric. A high sensitivity value is less persuasive if many positive ground-truth records were excluded. A phone comparison is weak if one phone appears only in one batch or lacks shared concentration levels with the other phone.
Spreadsheet follow-up: Pivot the exported data by phone model, batch and concentration/class. Look for empty or sparse combinations and confirm whether every section uses the same denominator for the same filter selection.
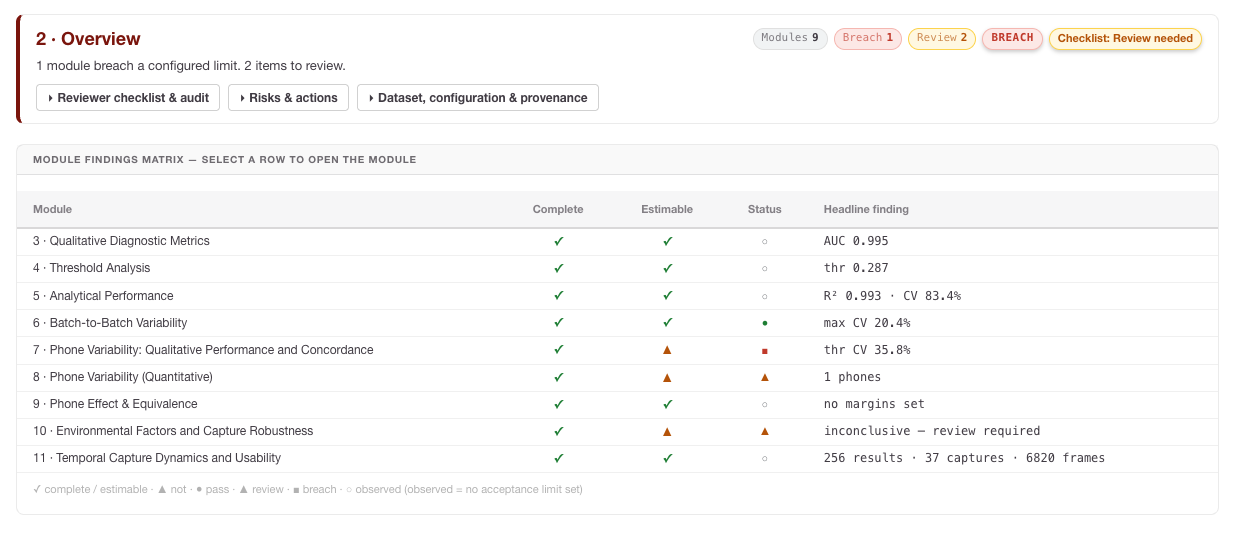
2 · Overview
The Overview gives a high-level summary of report findings and section states. Use it for triage, not as a replacement for detailed section review.
How to interpret it: Treat alert, review, unavailable or not-estimable states as signposts. They tell you which module needs deeper inspection, such as missing telemetry, insufficient ground truth, sparse phone comparisons or a failed fit.
3 · Qualitative Diagnostic Metrics
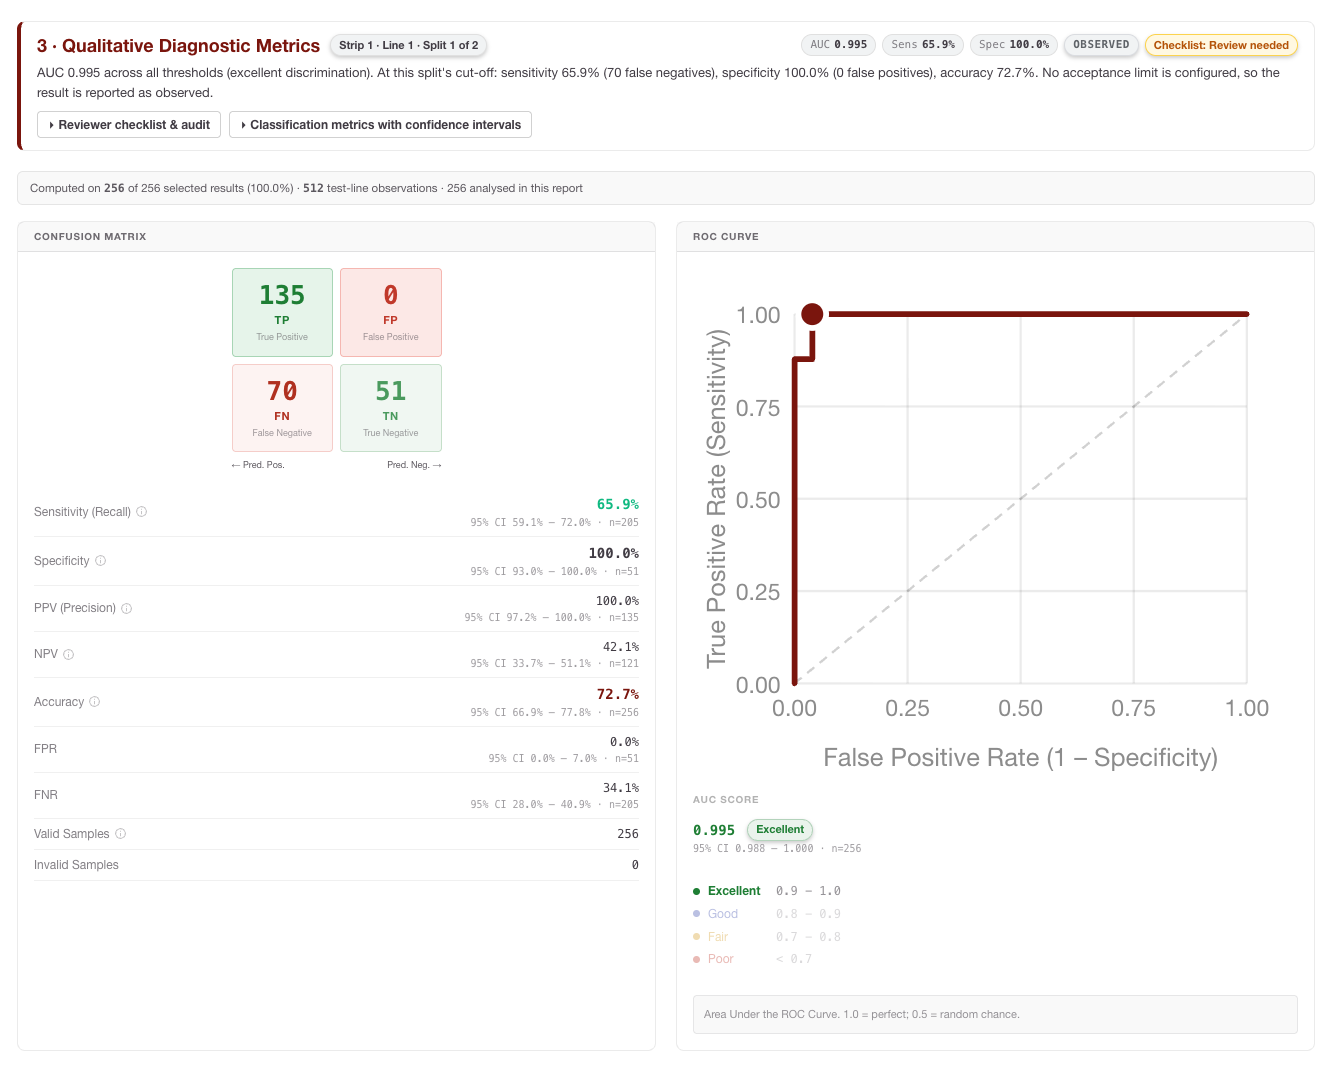
This section compares classifier calls with ground-truth classes for the selected test line and classifier split.
These equations evaluate the interpreter’s qualitative classifications against assigned Ground Truth reference classes (TP = True Positive, TN = True Negative, FP = False Positive, FN = False Negative).
Sensitivity (Positive Percent Agreement - PPA)
The proportion of actual positive samples that are correctly identified by the interpreter. It measures the assay's ability to avoid false negatives.
'%3e%3cg transform='translate(167%2c0)'%3e%3cg transform='translate(-13%2c0)'%3e%3cg transform='translate(0%2c28)'%3e%3cuse xlink:href='%23MJMAIN-53'%3e%3c/use%3e%3cuse xlink:href='%23MJMAIN-65' x='556' y='0'%3e%3c/use%3e%3cuse xlink:href='%23MJMAIN-6E' x='1001' y='0'%3e%3c/use%3e%3cuse xlink:href='%23MJMAIN-73' x='1557' y='0'%3e%3c/use%3e%3cuse xlink:href='%23MJMAIN-69' x='1952' y='0'%3e%3c/use%3e%3cuse xlink:href='%23MJMAIN-74' x='2230' y='0'%3e%3c/use%3e%3cuse xlink:href='%23MJMAIN-69' x='2620' y='0'%3e%3c/use%3e%3cuse xlink:href='%23MJMAIN-76' x='2898' y='0'%3e%3c/use%3e%3cuse xlink:href='%23MJMAIN-69' x='3427' y='0'%3e%3c/use%3e%3cuse xlink:href='%23MJMAIN-74' x='3705' y='0'%3e%3c/use%3e%3cuse xlink:href='%23MJMAIN-79' x='4095' y='0'%3e%3c/use%3e%3cuse xlink:href='%23MJMAIN-3D' x='4901' y='0'%3e%3c/use%3e%3cg transform='translate(5679%2c0)'%3e%3cg transform='translate(397%2c0)'%3e%3crect stroke='none' width='2858' height='60' x='0' y='220'%3e%3c/rect%3e%3cg transform='translate(914%2c420)'%3e%3cuse transform='scale(0.707)' xlink:href='%23MJMATHI-54' x='0' y='0'%3e%3c/use%3e%3cuse transform='scale(0.707)' xlink:href='%23MJMATHI-50' x='704' y='0'%3e%3c/use%3e%3c/g%3e%3cg transform='translate(60%2c-404)'%3e%3cuse transform='scale(0.707)' xlink:href='%23MJMATHI-54' x='0' y='0'%3e%3c/use%3e%3cuse transform='scale(0.707)' xlink:href='%23MJMATHI-50' x='704' y='0'%3e%3c/use%3e%3cuse transform='scale(0.707)' xlink:href='%23MJMAIN-2B' x='1456' y='0'%3e%3c/use%3e%3cuse transform='scale(0.707)' xlink:href='%23MJMATHI-46' x='2234' y='0'%3e%3c/use%3e%3cuse transform='scale(0.707)' xlink:href='%23MJMATHI-4E' x='2984' y='0'%3e%3c/use%3e%3c/g%3e%3c/g%3e%3c/g%3e%3c/g%3e%3c/g%3e%3c/g%3e%3c/g%3e%3c/svg%3e)
Specificity (Negative Percent Agreement - NPA)
The proportion of actual negative samples that are correctly identified by the interpreter. It measures the assay's ability to avoid false positives.
'%3e%3cg transform='translate(167%2c0)'%3e%3cg transform='translate(-13%2c0)'%3e%3cg transform='translate(0%2c28)'%3e%3cuse xlink:href='%23MJMAIN-53'%3e%3c/use%3e%3cuse xlink:href='%23MJMAIN-70' x='556' y='0'%3e%3c/use%3e%3cuse xlink:href='%23MJMAIN-65' x='1113' y='0'%3e%3c/use%3e%3cuse xlink:href='%23MJMAIN-63' x='1557' y='0'%3e%3c/use%3e%3cuse xlink:href='%23MJMAIN-69' x='2002' y='0'%3e%3c/use%3e%3cuse xlink:href='%23MJMAIN-66' x='2280' y='0'%3e%3c/use%3e%3cuse xlink:href='%23MJMAIN-69' x='2587' y='0'%3e%3c/use%3e%3cuse xlink:href='%23MJMAIN-63' x='2865' y='0'%3e%3c/use%3e%3cuse xlink:href='%23MJMAIN-69' x='3310' y='0'%3e%3c/use%3e%3cuse xlink:href='%23MJMAIN-74' x='3588' y='0'%3e%3c/use%3e%3cuse xlink:href='%23MJMAIN-79' x='3978' y='0'%3e%3c/use%3e%3cuse xlink:href='%23MJMAIN-3D' x='4784' y='0'%3e%3c/use%3e%3cg transform='translate(5562%2c0)'%3e%3cg transform='translate(397%2c0)'%3e%3crect stroke='none' width='2858' height='60' x='0' y='220'%3e%3c/rect%3e%3cg transform='translate(865%2c420)'%3e%3cuse transform='scale(0.707)' xlink:href='%23MJMATHI-54' x='0' y='0'%3e%3c/use%3e%3cuse transform='scale(0.707)' xlink:href='%23MJMATHI-4E' x='704' y='0'%3e%3c/use%3e%3c/g%3e%3cg transform='translate(60%2c-404)'%3e%3cuse transform='scale(0.707)' xlink:href='%23MJMATHI-54' x='0' y='0'%3e%3c/use%3e%3cuse transform='scale(0.707)' xlink:href='%23MJMATHI-4E' x='704' y='0'%3e%3c/use%3e%3cuse transform='scale(0.707)' xlink:href='%23MJMAIN-2B' x='1593' y='0'%3e%3c/use%3e%3cuse transform='scale(0.707)' xlink:href='%23MJMATHI-46' x='2371' y='0'%3e%3c/use%3e%3cuse transform='scale(0.707)' xlink:href='%23MJMATHI-50' x='3121' y='0'%3e%3c/use%3e%3c/g%3e%3c/g%3e%3c/g%3e%3c/g%3e%3c/g%3e%3c/g%3e%3c/g%3e%3c/svg%3e)
Positive Predictive Value (PPV)
The probability that a sample identified as positive by the interpreter is truly positive. This indicates the reliability of a positive result.
'%3e%3cg transform='translate(167%2c0)'%3e%3cg transform='translate(-13%2c0)'%3e%3cg transform='translate(0%2c28)'%3e%3cuse xlink:href='%23MJMAIN-50'%3e%3c/use%3e%3cuse xlink:href='%23MJMAIN-50' x='681' y='0'%3e%3c/use%3e%3cuse xlink:href='%23MJMAIN-56' x='1363' y='0'%3e%3c/use%3e%3cuse xlink:href='%23MJMAIN-3D' x='2391' y='0'%3e%3c/use%3e%3cg transform='translate(3169%2c0)'%3e%3cg transform='translate(397%2c0)'%3e%3crect stroke='none' width='2761' height='60' x='0' y='220'%3e%3c/rect%3e%3cg transform='translate(865%2c420)'%3e%3cuse transform='scale(0.707)' xlink:href='%23MJMATHI-54' x='0' y='0'%3e%3c/use%3e%3cuse transform='scale(0.707)' xlink:href='%23MJMATHI-50' x='704' y='0'%3e%3c/use%3e%3c/g%3e%3cg transform='translate(60%2c-404)'%3e%3cuse transform='scale(0.707)' xlink:href='%23MJMATHI-54' x='0' y='0'%3e%3c/use%3e%3cuse transform='scale(0.707)' xlink:href='%23MJMATHI-50' x='704' y='0'%3e%3c/use%3e%3cuse transform='scale(0.707)' xlink:href='%23MJMAIN-2B' x='1456' y='0'%3e%3c/use%3e%3cuse transform='scale(0.707)' xlink:href='%23MJMATHI-46' x='2234' y='0'%3e%3c/use%3e%3cuse transform='scale(0.707)' xlink:href='%23MJMATHI-50' x='2984' y='0'%3e%3c/use%3e%3c/g%3e%3c/g%3e%3c/g%3e%3c/g%3e%3c/g%3e%3c/g%3e%3c/g%3e%3c/svg%3e)
Negative Predictive Value (NPV)
The probability that a sample identified as negative by the interpreter is truly negative. This indicates the reliability of a negative result.
'%3e%3cg transform='translate(167%2c0)'%3e%3cg transform='translate(-13%2c0)'%3e%3cg transform='translate(0%2c28)'%3e%3cuse xlink:href='%23MJMAIN-4E'%3e%3c/use%3e%3cuse xlink:href='%23MJMAIN-50' x='750' y='0'%3e%3c/use%3e%3cuse xlink:href='%23MJMAIN-56' x='1432' y='0'%3e%3c/use%3e%3cuse xlink:href='%23MJMAIN-3D' x='2460' y='0'%3e%3c/use%3e%3cg transform='translate(3238%2c0)'%3e%3cg transform='translate(397%2c0)'%3e%3crect stroke='none' width='2955' height='60' x='0' y='220'%3e%3c/rect%3e%3cg transform='translate(914%2c420)'%3e%3cuse transform='scale(0.707)' xlink:href='%23MJMATHI-54' x='0' y='0'%3e%3c/use%3e%3cuse transform='scale(0.707)' xlink:href='%23MJMATHI-4E' x='704' y='0'%3e%3c/use%3e%3c/g%3e%3cg transform='translate(60%2c-404)'%3e%3cuse transform='scale(0.707)' xlink:href='%23MJMATHI-54' x='0' y='0'%3e%3c/use%3e%3cuse transform='scale(0.707)' xlink:href='%23MJMATHI-4E' x='704' y='0'%3e%3c/use%3e%3cuse transform='scale(0.707)' xlink:href='%23MJMAIN-2B' x='1593' y='0'%3e%3c/use%3e%3cuse transform='scale(0.707)' xlink:href='%23MJMATHI-46' x='2371' y='0'%3e%3c/use%3e%3cuse transform='scale(0.707)' xlink:href='%23MJMATHI-4E' x='3121' y='0'%3e%3c/use%3e%3c/g%3e%3c/g%3e%3c/g%3e%3c/g%3e%3c/g%3e%3c/g%3e%3c/g%3e%3c/svg%3e)
Overall Accuracy
The proportion of all samples (both positive and negative) that were correctly identified by the interpreter.
'%3e%3cg transform='translate(167%2c0)'%3e%3cg transform='translate(-13%2c0)'%3e%3cuse xlink:href='%23MJMAIN-41'%3e%3c/use%3e%3cuse xlink:href='%23MJMAIN-63' x='750' y='0'%3e%3c/use%3e%3cuse xlink:href='%23MJMAIN-63' x='1195' y='0'%3e%3c/use%3e%3cuse xlink:href='%23MJMAIN-75' x='1639' y='0'%3e%3c/use%3e%3cuse xlink:href='%23MJMAIN-72' x='2196' y='0'%3e%3c/use%3e%3cuse xlink:href='%23MJMAIN-61' x='2588' y='0'%3e%3c/use%3e%3cuse xlink:href='%23MJMAIN-63' x='3089' y='0'%3e%3c/use%3e%3cuse xlink:href='%23MJMAIN-79' x='3533' y='0'%3e%3c/use%3e%3cuse xlink:href='%23MJMAIN-3D' x='4339' y='0'%3e%3c/use%3e%3cg transform='translate(5118%2c0)'%3e%3cg transform='translate(397%2c0)'%3e%3crect stroke='none' width='6147' height='60' x='0' y='220'%3e%3c/rect%3e%3cg transform='translate(1720%2c478)'%3e%3cuse transform='scale(0.707)' xlink:href='%23MJMATHI-54' x='0' y='0'%3e%3c/use%3e%3cuse transform='scale(0.707)' xlink:href='%23MJMATHI-50' x='704' y='0'%3e%3c/use%3e%3cuse transform='scale(0.707)' xlink:href='%23MJMAIN-2B' x='1456' y='0'%3e%3c/use%3e%3cuse transform='scale(0.707)' xlink:href='%23MJMATHI-54' x='2234' y='0'%3e%3c/use%3e%3cuse transform='scale(0.707)' xlink:href='%23MJMATHI-4E' x='2939' y='0'%3e%3c/use%3e%3c/g%3e%3cg transform='translate(60%2c-404)'%3e%3cuse transform='scale(0.707)' xlink:href='%23MJMATHI-54' x='0' y='0'%3e%3c/use%3e%3cuse transform='scale(0.707)' xlink:href='%23MJMATHI-50' x='704' y='0'%3e%3c/use%3e%3cuse transform='scale(0.707)' xlink:href='%23MJMAIN-2B' x='1456' y='0'%3e%3c/use%3e%3cuse transform='scale(0.707)' xlink:href='%23MJMATHI-54' x='2234' y='0'%3e%3c/use%3e%3cuse transform='scale(0.707)' xlink:href='%23MJMATHI-4E' x='2939' y='0'%3e%3c/use%3e%3cuse transform='scale(0.707)' xlink:href='%23MJMAIN-2B' x='3827' y='0'%3e%3c/use%3e%3cuse transform='scale(0.707)' xlink:href='%23MJMATHI-46' x='4606' y='0'%3e%3c/use%3e%3cuse transform='scale(0.707)' xlink:href='%23MJMATHI-50' x='5355' y='0'%3e%3c/use%3e%3cuse transform='scale(0.707)' xlink:href='%23MJMAIN-2B' x='6107' y='0'%3e%3c/use%3e%3cuse transform='scale(0.707)' xlink:href='%23MJMATHI-46' x='6885' y='0'%3e%3c/use%3e%3cuse transform='scale(0.707)' xlink:href='%23MJMATHI-4E' x='7635' y='0'%3e%3c/use%3e%3c/g%3e%3c/g%3e%3c/g%3e%3c/g%3e%3c/g%3e%3c/g%3e%3c/svg%3e)
How to interpret it: For screening-style assays, false negatives may be the critical risk; for confirmatory use, false positives may dominate. Always read the denominator and confidence intervals with the point estimate. A metric based on very few positives or negatives can look impressive but be statistically fragile.
Spreadsheet follow-up: Recalculate metrics by site, run, batch, phone or concentration band to see whether the pooled result masks a subgroup problem.
4 · Threshold Analysis
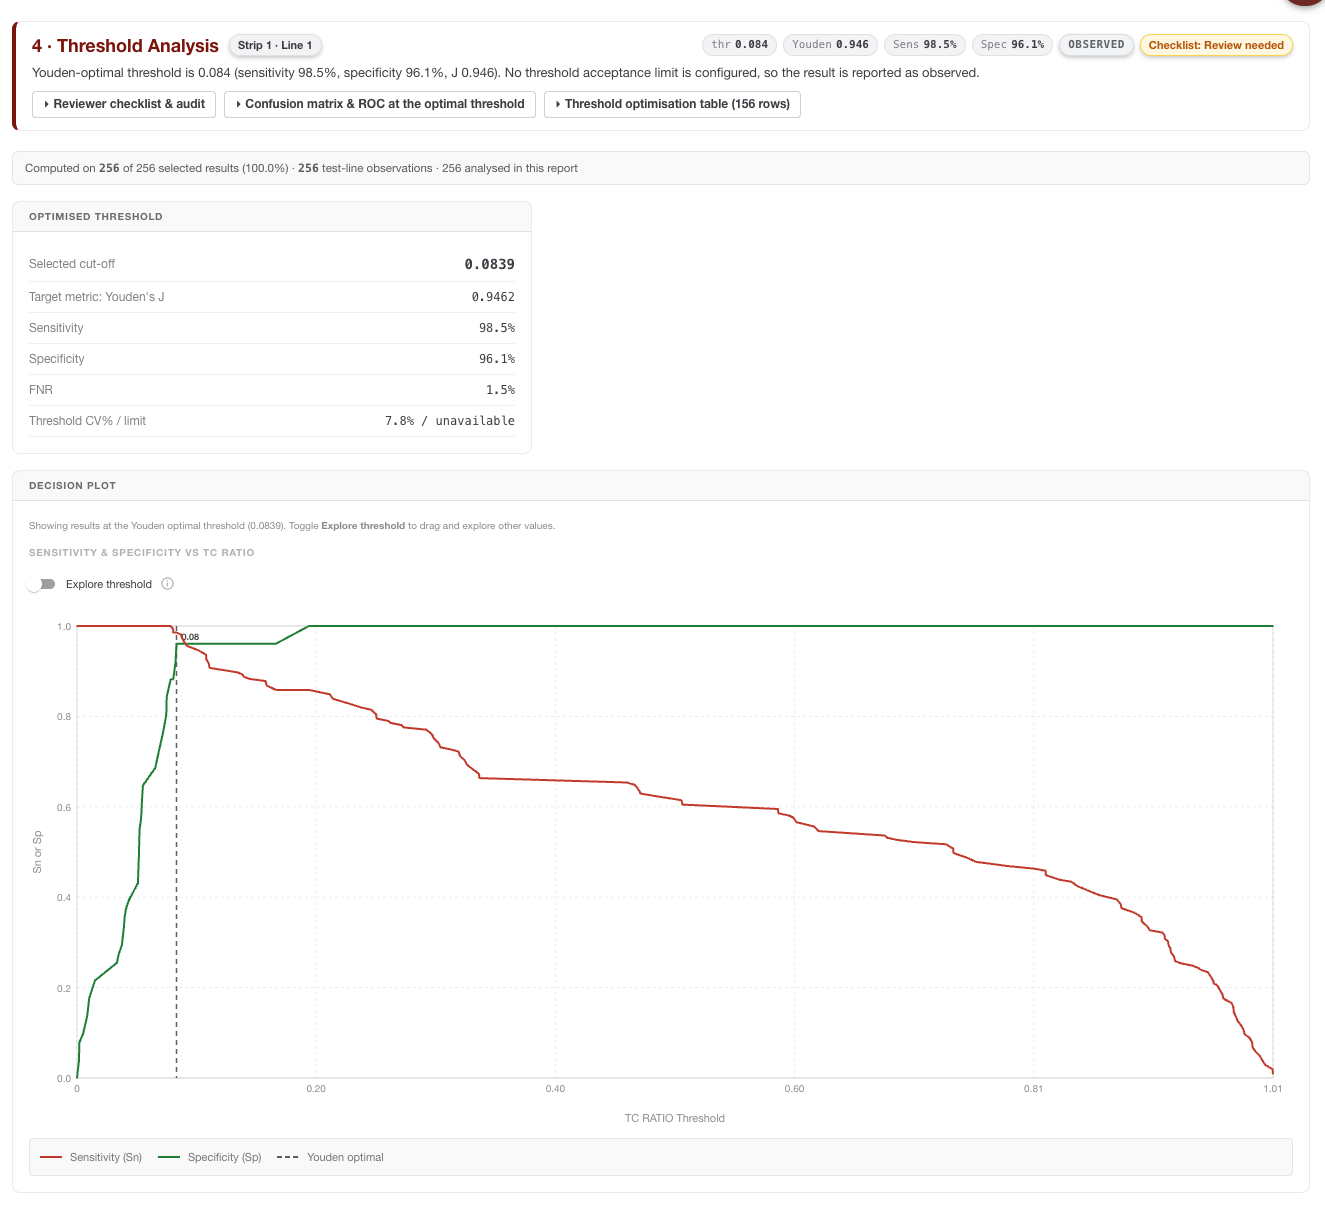
Threshold Analysis shows how classifier performance changes when the decision threshold moves. It typically includes ROC curves, AUC, threshold optimisation, Youden’s Index and decision plots.
ROC (Receiver Operating Characteristic) Curves
A visual representation of the trade-off between Sensitivity and Specificity. The curve plots the True Positive Rate against the False Positive Rate at various threshold settings. The Area Under the Curve (AUC) is also calculated, providing a single global metric for the interpreter's ability to discriminate between positive and negative samples.
Threshold Optimization Table
A detailed breakdown showing how specific diagnostic metrics (Sensitivity, Specificity, PPV, NPV) would shift if you moved your threshold up or down. This allows you to select a cut-off that prioritizes the specific clinical needs of your assay (e.g., maximizing sensitivity for a screening test).
Youden’s Index
![]()
'%3e%3cuse xlink:href='%23MJMATHI-4A' x='154' y='-50'%3e%3c/use%3e%3c/g%3e%3c/svg%3e)
To assist in identifying the mathematically "optimal" threshold, RARE calculates Youden’s Index for every point on the ROC curve. This index represents the point where the sum of Sensitivity and Specificity is maximized.
'%3e%3cg transform='translate(167%2c0)'%3e%3cg transform='translate(-13%2c0)'%3e%3cg transform='translate(0%2c-48)'%3e%3cuse xlink:href='%23MJMATHI-4A' x='0' y='0'%3e%3c/use%3e%3cuse xlink:href='%23MJMAIN-3D' x='911' y='0'%3e%3c/use%3e%3cg transform='translate(1967%2c0)'%3e%3cuse xlink:href='%23MJMAIN-53'%3e%3c/use%3e%3cuse xlink:href='%23MJMAIN-65' x='556' y='0'%3e%3c/use%3e%3cuse xlink:href='%23MJMAIN-6E' x='1001' y='0'%3e%3c/use%3e%3cuse xlink:href='%23MJMAIN-73' x='1557' y='0'%3e%3c/use%3e%3cuse xlink:href='%23MJMAIN-69' x='1952' y='0'%3e%3c/use%3e%3cuse xlink:href='%23MJMAIN-74' x='2230' y='0'%3e%3c/use%3e%3cuse xlink:href='%23MJMAIN-69' x='2620' y='0'%3e%3c/use%3e%3cuse xlink:href='%23MJMAIN-76' x='2898' y='0'%3e%3c/use%3e%3cuse xlink:href='%23MJMAIN-69' x='3427' y='0'%3e%3c/use%3e%3cuse xlink:href='%23MJMAIN-74' x='3705' y='0'%3e%3c/use%3e%3cuse xlink:href='%23MJMAIN-79' x='4095' y='0'%3e%3c/use%3e%3c/g%3e%3cuse xlink:href='%23MJMAIN-2B' x='6813' y='0'%3e%3c/use%3e%3cg transform='translate(7814%2c0)'%3e%3cuse xlink:href='%23MJMAIN-53'%3e%3c/use%3e%3cuse xlink:href='%23MJMAIN-70' x='556' y='0'%3e%3c/use%3e%3cuse xlink:href='%23MJMAIN-65' x='1113' y='0'%3e%3c/use%3e%3cuse xlink:href='%23MJMAIN-63' x='1557' y='0'%3e%3c/use%3e%3cuse xlink:href='%23MJMAIN-69' x='2002' y='0'%3e%3c/use%3e%3cuse xlink:href='%23MJMAIN-66' x='2280' y='0'%3e%3c/use%3e%3cuse xlink:href='%23MJMAIN-69' x='2587' y='0'%3e%3c/use%3e%3cuse xlink:href='%23MJMAIN-63' x='2865' y='0'%3e%3c/use%3e%3cuse xlink:href='%23MJMAIN-69' x='3310' y='0'%3e%3c/use%3e%3cuse xlink:href='%23MJMAIN-74' x='3588' y='0'%3e%3c/use%3e%3cuse xlink:href='%23MJMAIN-79' x='3978' y='0'%3e%3c/use%3e%3c/g%3e%3cuse xlink:href='%23MJMAIN-2212' x='12542' y='0'%3e%3c/use%3e%3cuse xlink:href='%23MJMAIN-31' x='13543' y='0'%3e%3c/use%3e%3c/g%3e%3c/g%3e%3c/g%3e%3c/g%3e%3c/svg%3e)
Decision Plot
In addition to the optimization table, the Decision Plot provides a powerful visual summary of your assay's performance across the entire threshold range. This dual-axis chart plots both Sensitivity and Specificity simultaneously against the threshold value.
The Decision Plot allows you to:
-
Identify the Crossover Point: Easily locate the "Equal Error Rate" where Sensitivity and Specificity intersect, representing a balanced performance profile.
-
Visualize Performance Trade-offs: See at a glance how rapidly Sensitivity drops or Specificity rises as you adjust your cut-off, helping you identify "stable" regions where minor variations in signal won't drastically impact clinical results.
-
Support Clinical Justification: By overlaying these two critical metrics, the plot provides a clear visual rationale for selecting a specific threshold—for example, choosing a point slightly to the left of the intersection to prioritize high Sensitivity for a screening application.
This graphical representation transforms the raw data of the optimization table into an intuitive tool for making informed, data-driven configuration decisions.
How to interpret it: The mathematical optimum is not always the clinically or operationally best threshold. Choose thresholds in the context of the assay’s intended use, risk tolerance, manufacturing variability and any phone-specific instability shown in section 7.
Spreadsheet follow-up: Export threshold tables and mark candidate thresholds that preserve acceptable sensitivity/specificity over a stable range rather than at a single sharp peak.
5 · Analytical Performance
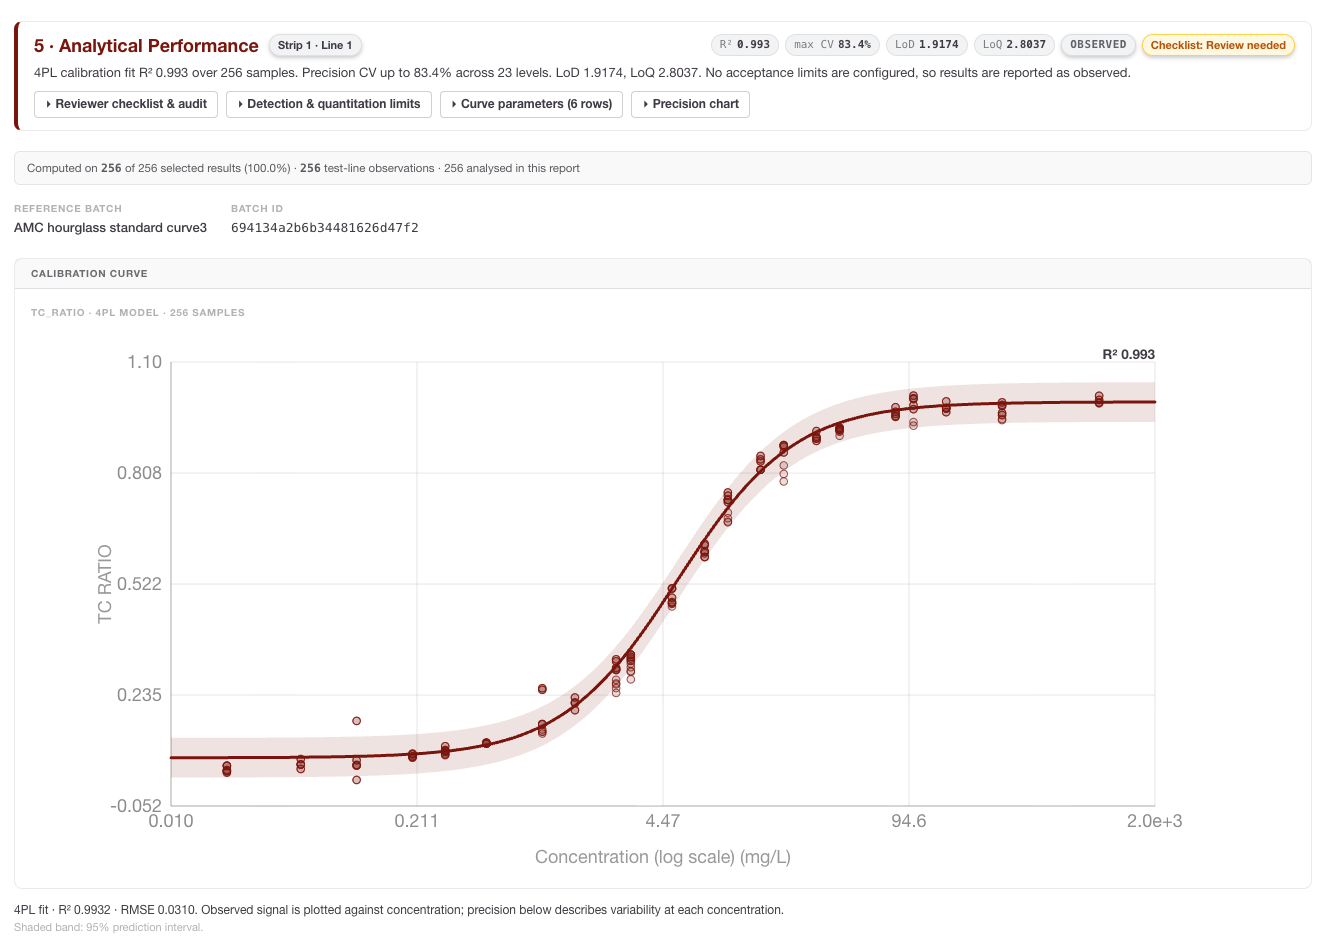
Analytical Performance evaluates the quantitative response. Depending on the configuration and dataset, it can include standard-curve fit, LoD, LoQ, linearity/regression, bias, recovery and precision.
-
LoD: the lowest signal or concentration distinguishable from background using the configured statistical approach.
-
LoQ: the lowest concentration that can be quantified with acceptable precision and accuracy.
Linearity and Regression Analysis
This module compares the interpreter's quantitative output against the expected Ground Truth values. RARE generates a scatter plot with a Linear Regression line to visualize the relationship. Key statistics provided include the Slope, Intercept, and the Coefficient of Determination
'%3e%3cg transform='translate(167%2c0)'%3e%3cg transform='translate(-13%2c0)'%3e%3cg transform='translate(0%2c-42)'%3e%3cuse xlink:href='%23MJMAIN-28' x='0' y='0'%3e%3c/use%3e%3cg transform='translate(389%2c0)'%3e%3cuse xlink:href='%23MJMATHI-52' x='0' y='0'%3e%3c/use%3e%3cuse transform='scale(0.707)' xlink:href='%23MJMAIN-32' x='1074' y='513'%3e%3c/use%3e%3c/g%3e%3cuse xlink:href='%23MJMAIN-29' x='1602' y='0'%3e%3c/use%3e%3c/g%3e%3c/g%3e%3c/g%3e%3c/g%3e%3c/svg%3e) , which indicates how well the data fits the linear model, where
'%3e%3cg transform='translate(167%2c0)'%3e%3cg transform='translate(-13%2c0)'%3e%3cg transform='translate(0%2c-47)'%3e%3cuse xlink:href='%23MJMATHI-79' x='0' y='0'%3e%3c/use%3e%3cuse xlink:href='%23MJMAIN-3D' x='775' y='0'%3e%3c/use%3e%3cuse xlink:href='%23MJMATHI-6D' x='1831' y='0'%3e%3c/use%3e%3cuse xlink:href='%23MJMATHI-78' x='2710' y='0'%3e%3c/use%3e%3cuse xlink:href='%23MJMAIN-2B' x='3504' y='0'%3e%3c/use%3e%3cuse xlink:href='%23MJMATHI-63' x='4505' y='0'%3e%3c/use%3e%3c/g%3e%3c/g%3e%3c/g%3e%3c/g%3e%3c/svg%3e) and
'%3e%3cg transform='translate(167%2c0)'%3e%3cg transform='translate(-13%2c0)'%3e%3cuse xlink:href='%23MJMATHI-52' x='0' y='0'%3e%3c/use%3e%3cuse transform='scale(0.707)' xlink:href='%23MJMAIN-32' x='1074' y='513'%3e%3c/use%3e%3cuse xlink:href='%23MJMAIN-3D' x='1491' y='0'%3e%3c/use%3e%3cuse xlink:href='%23MJMAIN-31' x='2547' y='0'%3e%3c/use%3e%3cuse xlink:href='%23MJMAIN-2212' x='3270' y='0'%3e%3c/use%3e%3cg transform='translate(4048%2c0)'%3e%3cg transform='translate(342%2c0)'%3e%3crect stroke='none' width='1774' height='60' x='0' y='220'%3e%3c/rect%3e%3cg transform='translate(60%2c531)'%3e%3cuse transform='scale(0.707)' xlink:href='%23MJMATHI-53' x='0' y='0'%3e%3c/use%3e%3cg transform='translate(456%2c0)'%3e%3cuse transform='scale(0.707)' xlink:href='%23MJMATHI-53' x='0' y='0'%3e%3c/use%3e%3cg transform='translate(433%2c-107)'%3e%3cuse transform='scale(0.5)' xlink:href='%23MJMATHI-72' x='0' y='0'%3e%3c/use%3e%3cuse transform='scale(0.5)' xlink:href='%23MJMATHI-65' x='451' y='0'%3e%3c/use%3e%3cuse transform='scale(0.5)' xlink:href='%23MJMATHI-73' x='918' y='0'%3e%3c/use%3e%3c/g%3e%3c/g%3e%3c/g%3e%3cg transform='translate(104%2c-419)'%3e%3cuse transform='scale(0.707)' xlink:href='%23MJMATHI-53' x='0' y='0'%3e%3c/use%3e%3cg transform='translate(456%2c0)'%3e%3cuse transform='scale(0.707)' xlink:href='%23MJMATHI-53' x='0' y='0'%3e%3c/use%3e%3cg transform='translate(433%2c-107)'%3e%3cuse transform='scale(0.5)' xlink:href='%23MJMATHI-74' x='0' y='0'%3e%3c/use%3e%3cuse transform='scale(0.5)' xlink:href='%23MJMATHI-6F' x='361' y='0'%3e%3c/use%3e%3cuse transform='scale(0.5)' xlink:href='%23MJMATHI-74' x='847' y='0'%3e%3c/use%3e%3c/g%3e%3c/g%3e%3c/g%3e%3c/g%3e%3c/g%3e%3c/g%3e%3c/g%3e%3c/g%3e%3c/svg%3e)
Bias and Recovery
This analysis determines if the system consistently over- or under-estimates concentrations. RARE calculates the Percent Recovery for each sample, providing a clear view of systematic error across different concentration levels.
'%3e%3cg transform='translate(167%2c0)'%3e%3cg transform='translate(-13%2c0)'%3e%3cuse xlink:href='%23MJMAIN-25'%3e%3c/use%3e%3cuse xlink:href='%23MJMAIN-52' x='1083' y='0'%3e%3c/use%3e%3cuse xlink:href='%23MJMAIN-65' x='1820' y='0'%3e%3c/use%3e%3cuse xlink:href='%23MJMAIN-63' x='2264' y='0'%3e%3c/use%3e%3cuse xlink:href='%23MJMAIN-6F' x='2709' y='0'%3e%3c/use%3e%3cuse xlink:href='%23MJMAIN-76' x='3209' y='0'%3e%3c/use%3e%3cuse xlink:href='%23MJMAIN-65' x='3738' y='0'%3e%3c/use%3e%3cuse xlink:href='%23MJMAIN-72' x='4182' y='0'%3e%3c/use%3e%3cuse xlink:href='%23MJMAIN-79' x='4575' y='0'%3e%3c/use%3e%3cuse xlink:href='%23MJMAIN-3D' x='5381' y='0'%3e%3c/use%3e%3cg transform='translate(6437%2c0)'%3e%3cuse xlink:href='%23MJSZ2-28'%3e%3c/use%3e%3cg transform='translate(597%2c0)'%3e%3cg transform='translate(120%2c0)'%3e%3crect stroke='none' width='6627' height='60' x='0' y='220'%3e%3c/rect%3e%3cg transform='translate(806%2c435)'%3e%3cuse transform='scale(0.707)' xlink:href='%23MJMAIN-4D'%3e%3c/use%3e%3cuse transform='scale(0.707)' xlink:href='%23MJMAIN-65' x='917' y='0'%3e%3c/use%3e%3cuse transform='scale(0.707)' xlink:href='%23MJMAIN-61' x='1362' y='0'%3e%3c/use%3e%3cuse transform='scale(0.707)' xlink:href='%23MJMAIN-73' x='1862' y='0'%3e%3c/use%3e%3cuse transform='scale(0.707)' xlink:href='%23MJMAIN-75' x='2257' y='0'%3e%3c/use%3e%3cuse transform='scale(0.707)' xlink:href='%23MJMAIN-72' x='2813' y='0'%3e%3c/use%3e%3cuse transform='scale(0.707)' xlink:href='%23MJMAIN-65' x='3205' y='0'%3e%3c/use%3e%3cuse transform='scale(0.707)' xlink:href='%23MJMAIN-64' x='3650' y='0'%3e%3c/use%3e%3cuse transform='scale(0.707)' xlink:href='%23MJMAIN-56' x='4560' y='0'%3e%3c/use%3e%3cuse transform='scale(0.707)' xlink:href='%23MJMAIN-61' x='5311' y='0'%3e%3c/use%3e%3cuse transform='scale(0.707)' xlink:href='%23MJMAIN-6C' x='5811' y='0'%3e%3c/use%3e%3cuse transform='scale(0.707)' xlink:href='%23MJMAIN-75' x='6090' y='0'%3e%3c/use%3e%3cuse transform='scale(0.707)' xlink:href='%23MJMAIN-65' x='6646' y='0'%3e%3c/use%3e%3c/g%3e%3cg transform='translate(60%2c-419)'%3e%3cuse transform='scale(0.707)' xlink:href='%23MJMAIN-47'%3e%3c/use%3e%3cuse transform='scale(0.707)' xlink:href='%23MJMAIN-72' x='785' y='0'%3e%3c/use%3e%3cuse transform='scale(0.707)' xlink:href='%23MJMAIN-6F' x='1178' y='0'%3e%3c/use%3e%3cuse transform='scale(0.707)' xlink:href='%23MJMAIN-75' x='1678' y='0'%3e%3c/use%3e%3cuse transform='scale(0.707)' xlink:href='%23MJMAIN-6E' x='2235' y='0'%3e%3c/use%3e%3cuse transform='scale(0.707)' xlink:href='%23MJMAIN-64' x='2791' y='0'%3e%3c/use%3e%3cuse transform='scale(0.707)' xlink:href='%23MJMAIN-54' x='3701' y='0'%3e%3c/use%3e%3cuse transform='scale(0.707)' xlink:href='%23MJMAIN-72' x='4424' y='0'%3e%3c/use%3e%3cuse transform='scale(0.707)' xlink:href='%23MJMAIN-75' x='4816' y='0'%3e%3c/use%3e%3cuse transform='scale(0.707)' xlink:href='%23MJMAIN-74' x='5373' y='0'%3e%3c/use%3e%3cuse transform='scale(0.707)' xlink:href='%23MJMAIN-68' x='5762' y='0'%3e%3c/use%3e%3cuse transform='scale(0.707)' xlink:href='%23MJMAIN-56' x='6672' y='0'%3e%3c/use%3e%3cuse transform='scale(0.707)' xlink:href='%23MJMAIN-61' x='7423' y='0'%3e%3c/use%3e%3cuse transform='scale(0.707)' xlink:href='%23MJMAIN-6C' x='7923' y='0'%3e%3c/use%3e%3cuse transform='scale(0.707)' xlink:href='%23MJMAIN-75' x='8202' y='0'%3e%3c/use%3e%3cuse transform='scale(0.707)' xlink:href='%23MJMAIN-65' x='8758' y='0'%3e%3c/use%3e%3c/g%3e%3c/g%3e%3c/g%3e%3cuse xlink:href='%23MJSZ2-29' x='7465' y='-1'%3e%3c/use%3e%3c/g%3e%3cuse xlink:href='%23MJMAIN-D7' x='14722' y='0'%3e%3c/use%3e%3cg transform='translate(15723%2c0)'%3e%3cuse xlink:href='%23MJMAIN-31'%3e%3c/use%3e%3cuse xlink:href='%23MJMAIN-30' x='500' y='0'%3e%3c/use%3e%3cuse xlink:href='%23MJMAIN-30' x='1001' y='0'%3e%3c/use%3e%3c/g%3e%3c/g%3e%3c/g%3e%3c/g%3e%3c/svg%3e)
Precision (Repeatability)
By analyzing replicates within your dataset, RARE evaluates the "closeness of agreement" between independent results. This is expressed as the Coefficient of Variation (%CV), a standardized measure of dispersion that allows you to assess the stability of your assay and interpreter across multiple runs.
'%3e%3cg transform='translate(167%2c0)'%3e%3cg transform='translate(-13%2c0)'%3e%3cuse xlink:href='%23MJMAIN-25'%3e%3c/use%3e%3cuse xlink:href='%23MJMAIN-43' x='833' y='0'%3e%3c/use%3e%3cuse xlink:href='%23MJMAIN-56' x='1556' y='0'%3e%3c/use%3e%3cuse xlink:href='%23MJMAIN-3D' x='2584' y='0'%3e%3c/use%3e%3cg transform='translate(3640%2c0)'%3e%3cuse xlink:href='%23MJSZ2-28'%3e%3c/use%3e%3cg transform='translate(597%2c0)'%3e%3cg transform='translate(120%2c0)'%3e%3crect stroke='none' width='546' height='60' x='0' y='220'%3e%3c/rect%3e%3cuse transform='scale(0.707)' xlink:href='%23MJMATHI-3C3' x='100' y='605'%3e%3c/use%3e%3cuse transform='scale(0.707)' xlink:href='%23MJMATHI-3BC' x='84' y='-488'%3e%3c/use%3e%3c/g%3e%3c/g%3e%3cuse xlink:href='%23MJSZ2-29' x='1384' y='-1'%3e%3c/use%3e%3c/g%3e%3cuse xlink:href='%23MJMAIN-D7' x='5844' y='0'%3e%3c/use%3e%3cg transform='translate(6845%2c0)'%3e%3cuse xlink:href='%23MJMAIN-31'%3e%3c/use%3e%3cuse xlink:href='%23MJMAIN-30' x='500' y='0'%3e%3c/use%3e%3cuse xlink:href='%23MJMAIN-30' x='1001' y='0'%3e%3c/use%3e%3c/g%3e%3c/g%3e%3c/g%3e%3c/g%3e%3c/svg%3e)
where
'%3e%3cuse xlink:href='%23MJMATHI-3C3' x='154' y='-50'%3e%3c/use%3e%3c/g%3e%3c/svg%3e) is the standard deviation and
'%3e%3cuse xlink:href='%23MJMATHI-3BC' x='154' y='-42'%3e%3c/use%3e%3c/g%3e%3c/svg%3e) is the mean of the replicates.
How to interpret it: Focus on concentration-level behaviour. A good overall regression can still hide poor precision near the decision threshold or at low concentrations. For LF assays, inspect whether the calibration curve is plausible across the useful range and whether residuals show systematic structure.
Spreadsheet follow-up: Plot residuals by concentration and batch. Compare CV% near the clinical threshold with CV% at high concentrations; the threshold-adjacent region is often more important for classification reliability.
6 · Batch-to-Batch Variability
Batch-to-Batch Variability section provides the critical evidence needed to demonstrate the robustness of your interpreter across different manufacturing lots. In lateral flow production, slight variations in materials or reagent deposition can impact signal intensity; This section compares calibration behaviour across manufacturing lots or batch configurations. It can include curve overlays, parameter comparison tables and residual distributions.
Based on the analysis modules, this section includes:
-
Calibration Curve Overlay: This plot displays the mathematical fit for each batch configuration included in the report. By overlaying these curves, you can visually assess if different lots follow the same response trajectory or if there is a "shift" in signal intensity across the concentration range.
-
Parameter Comparison Table: RARE extracts the key coefficients from the underlying 4PL or 5PL models (such as Slope, EC50, and Asymptotes) and presents them side-by-side. This allows you to quantify exactly how the biochemical response varies between lots.
-
Residuals (Observed - Predicted) Box Plot: This diagnostic tool visualizes the distribution of error for each batch. It helps you identify if a specific lot has a higher degree of "noise" or a consistent bias compared to the others.
How to interpret it: Look for curve shifts, parameter differences and residual bias. A consistent upward or downward residual pattern for one batch may indicate lot-specific signal behaviour. Wide residual distributions suggest lower precision or inconsistent manufacturing/capture conditions.
Spreadsheet follow-up: Pivot residuals and recovery by batch and concentration. If one batch differs mainly at low concentration, the practical impact may be different from a whole-curve shift.
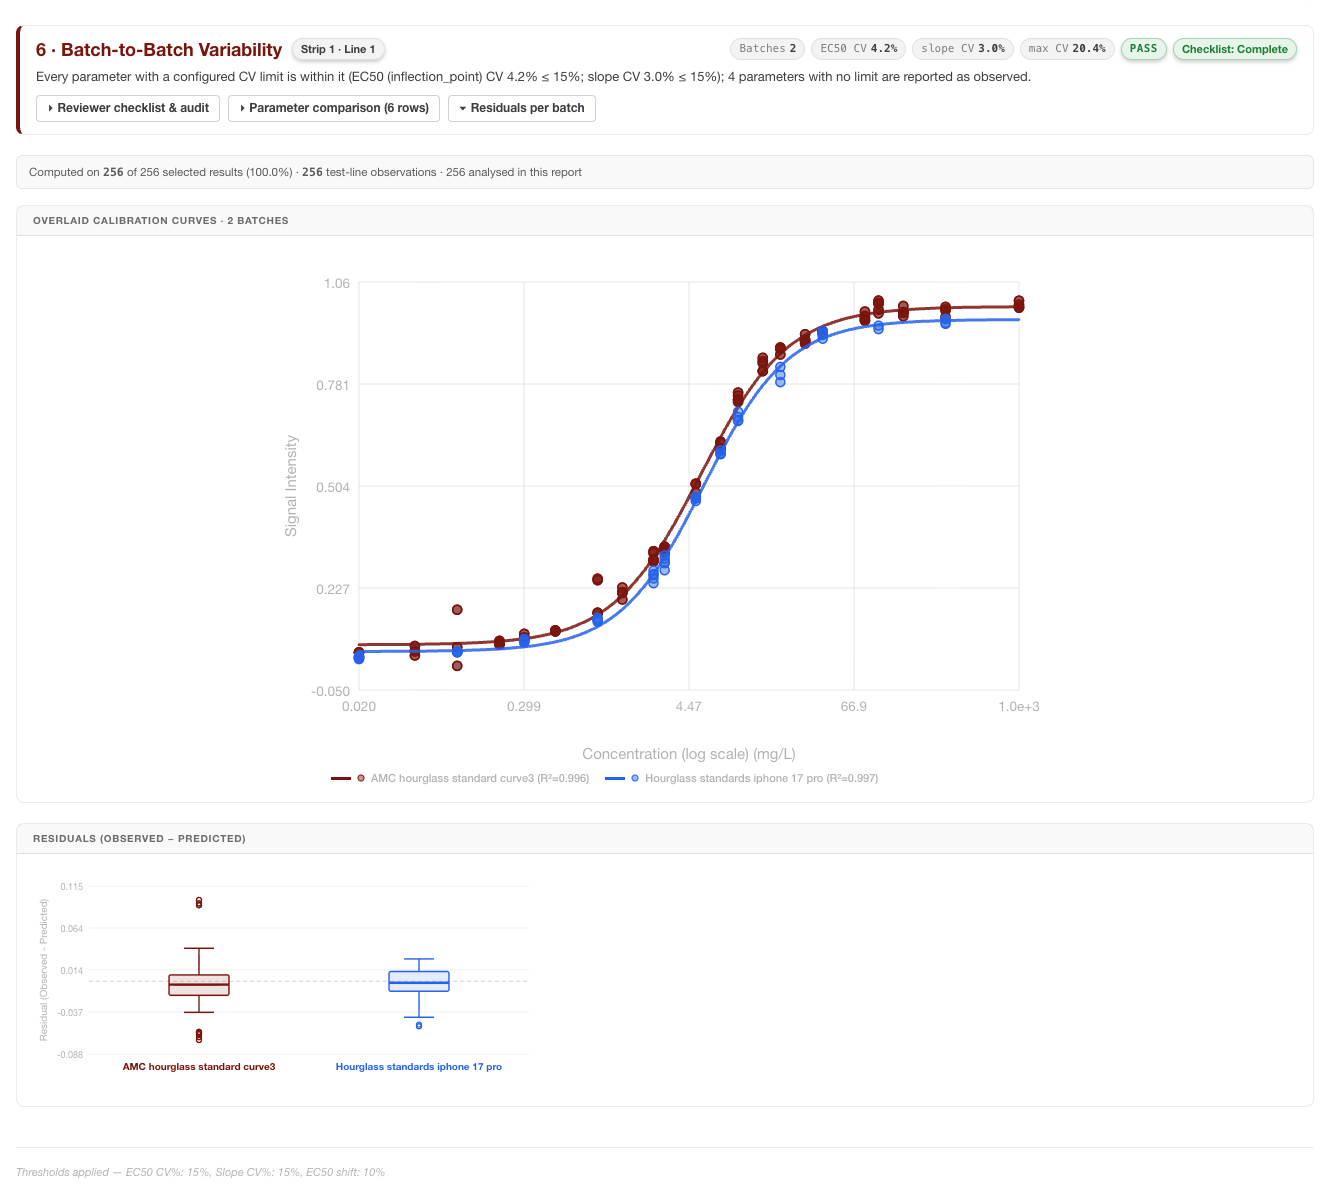
Understanding the Residuals Box Plot
The box plots in this section allow you to see at a glance how consistently each batch is performing. For each batch:
-
The Center Line (Median): Represents the median residual. If this line is at zero, the batch is perfectly centered on the Ground Truth. If it is consistently above or below zero, it indicates a systematic bias for that specific lot.
-
The Box (Interquartile Range - IQR): Represents the middle 50% of your data. A "taller" box indicates higher variability (lower precision) within that batch.
-
The Whiskers: Extend to show the spread of the rest of the data.
-
Outliers (Individual Dots): Any results that fall significantly outside the expected range are plotted as individual points, helping you identify specific samples that may have had physical defects or interpretation anomalies.
Batch Comparison Metrics
RARE calculates how each "Test" batch deviates from the designated Reference Batch using the following formulae:
Mean Residual (Bias):
The average difference between the measured values and the Ground Truth for the batch.
'%3e%3cg transform='translate(167%2c0)'%3e%3cg transform='translate(-13%2c0)'%3e%3cg transform='translate(0%2c-146)'%3e%3cuse xlink:href='%23MJMAIN-4D'%3e%3c/use%3e%3cuse xlink:href='%23MJMAIN-65' x='917' y='0'%3e%3c/use%3e%3cuse xlink:href='%23MJMAIN-61' x='1362' y='0'%3e%3c/use%3e%3cuse xlink:href='%23MJMAIN-6E' x='1862' y='0'%3e%3c/use%3e%3cuse xlink:href='%23MJMAIN-52' x='2669' y='0'%3e%3c/use%3e%3cuse xlink:href='%23MJMAIN-65' x='3405' y='0'%3e%3c/use%3e%3cuse xlink:href='%23MJMAIN-73' x='3850' y='0'%3e%3c/use%3e%3cuse xlink:href='%23MJMAIN-69' x='4244' y='0'%3e%3c/use%3e%3cuse xlink:href='%23MJMAIN-64' x='4523' y='0'%3e%3c/use%3e%3cuse xlink:href='%23MJMAIN-75' x='5079' y='0'%3e%3c/use%3e%3cuse xlink:href='%23MJMAIN-61' x='5636' y='0'%3e%3c/use%3e%3cuse xlink:href='%23MJMAIN-6C' x='6136' y='0'%3e%3c/use%3e%3cuse xlink:href='%23MJMAIN-3D' x='6692' y='0'%3e%3c/use%3e%3cg transform='translate(7471%2c0)'%3e%3cg transform='translate(397%2c0)'%3e%3crect stroke='none' width='13600' height='60' x='0' y='220'%3e%3c/rect%3e%3cg transform='translate(60%2c737)'%3e%3cuse xlink:href='%23MJSZ1-2211' x='0' y='0'%3e%3c/use%3e%3cuse xlink:href='%23MJMAIN-28' x='1056' y='0'%3e%3c/use%3e%3cg transform='translate(1446%2c0)'%3e%3cuse xlink:href='%23MJMAIN-4D'%3e%3c/use%3e%3cuse xlink:href='%23MJMAIN-65' x='917' y='0'%3e%3c/use%3e%3cuse xlink:href='%23MJMAIN-61' x='1362' y='0'%3e%3c/use%3e%3cuse xlink:href='%23MJMAIN-73' x='1862' y='0'%3e%3c/use%3e%3cuse xlink:href='%23MJMAIN-75' x='2257' y='0'%3e%3c/use%3e%3cuse xlink:href='%23MJMAIN-72' x='2813' y='0'%3e%3c/use%3e%3cuse xlink:href='%23MJMAIN-65' x='3206' y='0'%3e%3c/use%3e%3cuse xlink:href='%23MJMAIN-64' x='3650' y='0'%3e%3c/use%3e%3c/g%3e%3cuse xlink:href='%23MJMAIN-2212' x='5875' y='0'%3e%3c/use%3e%3cg transform='translate(6875%2c0)'%3e%3cuse xlink:href='%23MJMAIN-47'%3e%3c/use%3e%3cuse xlink:href='%23MJMAIN-72' x='785' y='0'%3e%3c/use%3e%3cuse xlink:href='%23MJMAIN-6F' x='1178' y='0'%3e%3c/use%3e%3cuse xlink:href='%23MJMAIN-75' x='1678' y='0'%3e%3c/use%3e%3cuse xlink:href='%23MJMAIN-6E' x='2235' y='0'%3e%3c/use%3e%3cuse xlink:href='%23MJMAIN-64' x='2791' y='0'%3e%3c/use%3e%3cuse xlink:href='%23MJMAIN-54' x='3598' y='0'%3e%3c/use%3e%3cuse xlink:href='%23MJMAIN-72' x='4320' y='0'%3e%3c/use%3e%3cuse xlink:href='%23MJMAIN-75' x='4713' y='0'%3e%3c/use%3e%3cuse xlink:href='%23MJMAIN-74' x='5269' y='0'%3e%3c/use%3e%3cuse xlink:href='%23MJMAIN-68' x='5659' y='0'%3e%3c/use%3e%3c/g%3e%3cuse xlink:href='%23MJMAIN-29' x='13091' y='0'%3e%3c/use%3e%3c/g%3e%3cuse xlink:href='%23MJMATHI-6E' x='6500' y='-686'%3e%3c/use%3e%3c/g%3e%3c/g%3e%3c/g%3e%3c/g%3e%3c/g%3e%3c/g%3e%3c/svg%3e)
Batch-Specific Coefficient of Variation (%CV):
This metric quantifies the precision of the residuals for a specific batch, allowing you to compare the "tightness" of results against your reference lot.
'%3e%3cg transform='translate(167%2c0)'%3e%3cg transform='translate(-13%2c0)'%3e%3cuse xlink:href='%23MJMAIN-25'%3e%3c/use%3e%3cuse xlink:href='%23MJMAIN-43' x='833' y='0'%3e%3c/use%3e%3cuse xlink:href='%23MJMAIN-56' x='1556' y='0'%3e%3c/use%3e%3cg transform='translate(2306%2c0)'%3e%3cuse xlink:href='%23MJMATHI-62' x='0' y='0'%3e%3c/use%3e%3cuse xlink:href='%23MJMATHI-61' x='429' y='0'%3e%3c/use%3e%3cuse xlink:href='%23MJMATHI-74' x='959' y='0'%3e%3c/use%3e%3cuse xlink:href='%23MJMATHI-63' x='1320' y='0'%3e%3c/use%3e%3cuse xlink:href='%23MJMATHI-68' x='1754' y='0'%3e%3c/use%3e%3c/g%3e%3cuse xlink:href='%23MJMAIN-3D' x='4914' y='0'%3e%3c/use%3e%3cg transform='translate(5971%2c0)'%3e%3cuse xlink:href='%23MJSZ3-28'%3e%3c/use%3e%3cg transform='translate(736%2c0)'%3e%3cg transform='translate(120%2c0)'%3e%3crect stroke='none' width='2981' height='60' x='0' y='220'%3e%3c/rect%3e%3cg transform='translate(60%2c676)'%3e%3cuse xlink:href='%23MJMATHI-53' x='0' y='0'%3e%3c/use%3e%3cuse xlink:href='%23MJMATHI-44' x='645' y='0'%3e%3c/use%3e%3cg transform='translate(1474%2c0)'%3e%3cuse xlink:href='%23MJMATHI-72' x='0' y='0'%3e%3c/use%3e%3cuse xlink:href='%23MJMATHI-65' x='451' y='0'%3e%3c/use%3e%3cuse xlink:href='%23MJMATHI-73' x='918' y='0'%3e%3c/use%3e%3c/g%3e%3c/g%3e%3cg transform='translate(315%2c-686)'%3e%3cuse xlink:href='%23MJMATHI-3BC' x='0' y='0'%3e%3c/use%3e%3cg transform='translate(603%2c-150)'%3e%3cuse transform='scale(0.707)' xlink:href='%23MJMATHI-62' x='0' y='0'%3e%3c/use%3e%3cuse transform='scale(0.707)' xlink:href='%23MJMATHI-61' x='429' y='0'%3e%3c/use%3e%3cuse transform='scale(0.707)' xlink:href='%23MJMATHI-74' x='959' y='0'%3e%3c/use%3e%3cuse transform='scale(0.707)' xlink:href='%23MJMATHI-63' x='1320' y='0'%3e%3c/use%3e%3cuse transform='scale(0.707)' xlink:href='%23MJMATHI-68' x='1754' y='0'%3e%3c/use%3e%3c/g%3e%3c/g%3e%3c/g%3e%3c/g%3e%3cuse xlink:href='%23MJSZ3-29' x='3958' y='-1'%3e%3c/use%3e%3c/g%3e%3cuse xlink:href='%23MJMAIN-D7' x='10887' y='0'%3e%3c/use%3e%3cg transform='translate(11888%2c0)'%3e%3cuse xlink:href='%23MJMAIN-31'%3e%3c/use%3e%3cuse xlink:href='%23MJMAIN-30' x='500' y='0'%3e%3c/use%3e%3cuse xlink:href='%23MJMAIN-30' x='1001' y='0'%3e%3c/use%3e%3c/g%3e%3c/g%3e%3c/g%3e%3c/g%3e%3c/svg%3e)
By analyzing these plots and tables, you can objectively determine if a new manufacturing lot is performing within your established QC tolerances or if it requires a unique calibration update.
7 · Phone Variability: Qualitative Performance and Threshold Stability
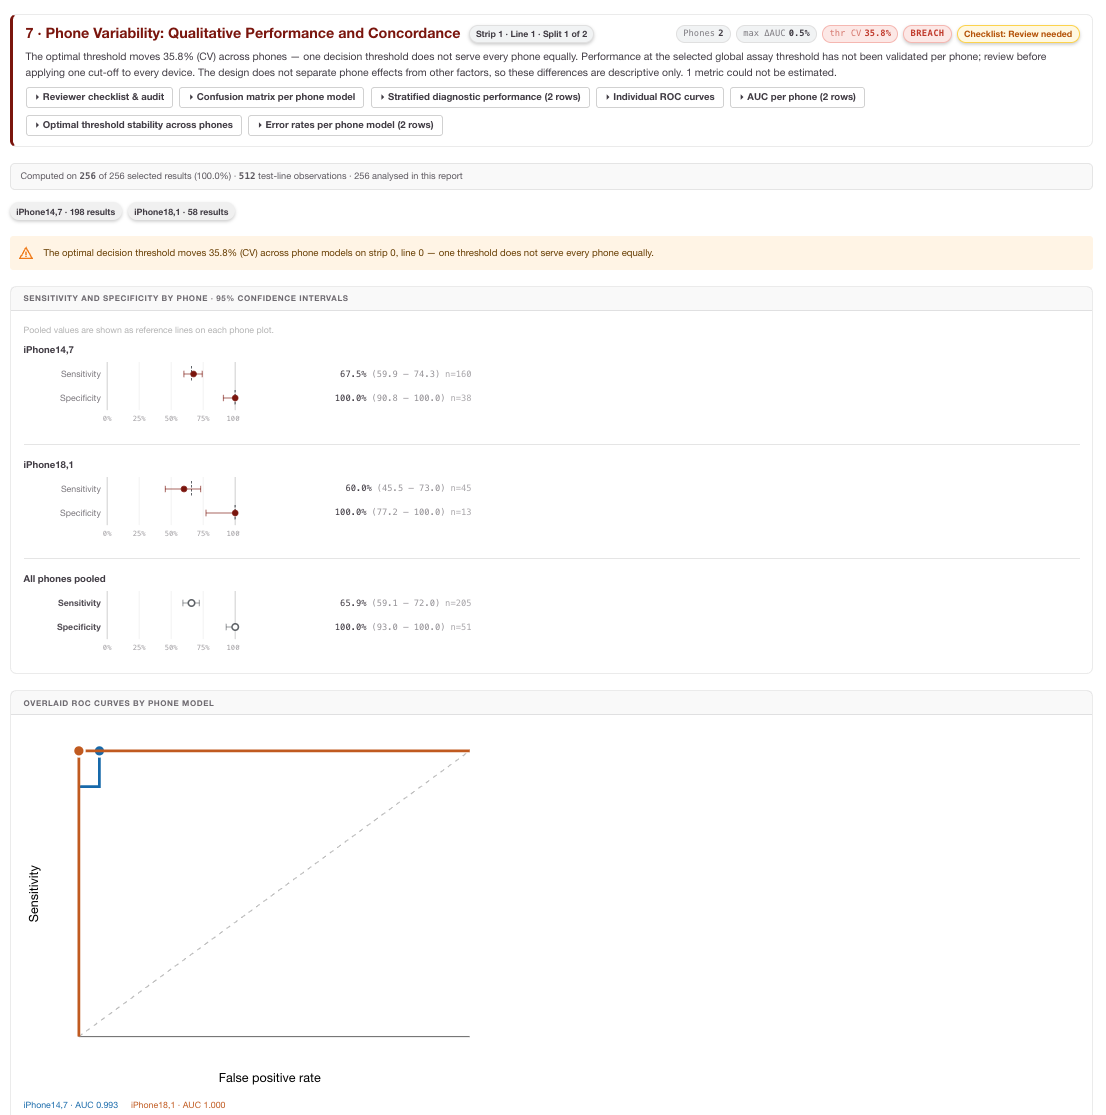
This section reports diagnostic classification performance separately by smartphone model. It includes per-phone confusion matrices, sensitivity, specificity, accuracy, PPV, NPV, false-positive rate and false-negative rate, with denominators and 95% confidence intervals where estimable. It can also show per-phone ROC curves, AUC with confidence intervals and Youden-optimal threshold stability.
The section is available when a classifier has been applied and at least two known phone models each have enough ground-truth results. Smaller additional groups may be shown but do not necessarily support every metric.
How to interpret it: Compare both point estimates and confidence intervals. A phone with higher false negatives may be more important than one with a small accuracy difference. Threshold CV% or a wide range of phone-specific optimal thresholds suggests that a pooled threshold may not behave uniformly across phone models.
Limitation: These outputs are descriptive phone-stratified comparisons. They do not, by themselves, prove paired inter-phone concordance, device equivalence or validation of a common threshold across all phone models.
Spreadsheet follow-up: Export per-phone metrics and review FN/FP counts by concentration or signal band. Investigate whether one phone is overrepresented near the threshold, because that can magnify apparent diagnostic differences.
8 · Phone Variability (Quantitative)
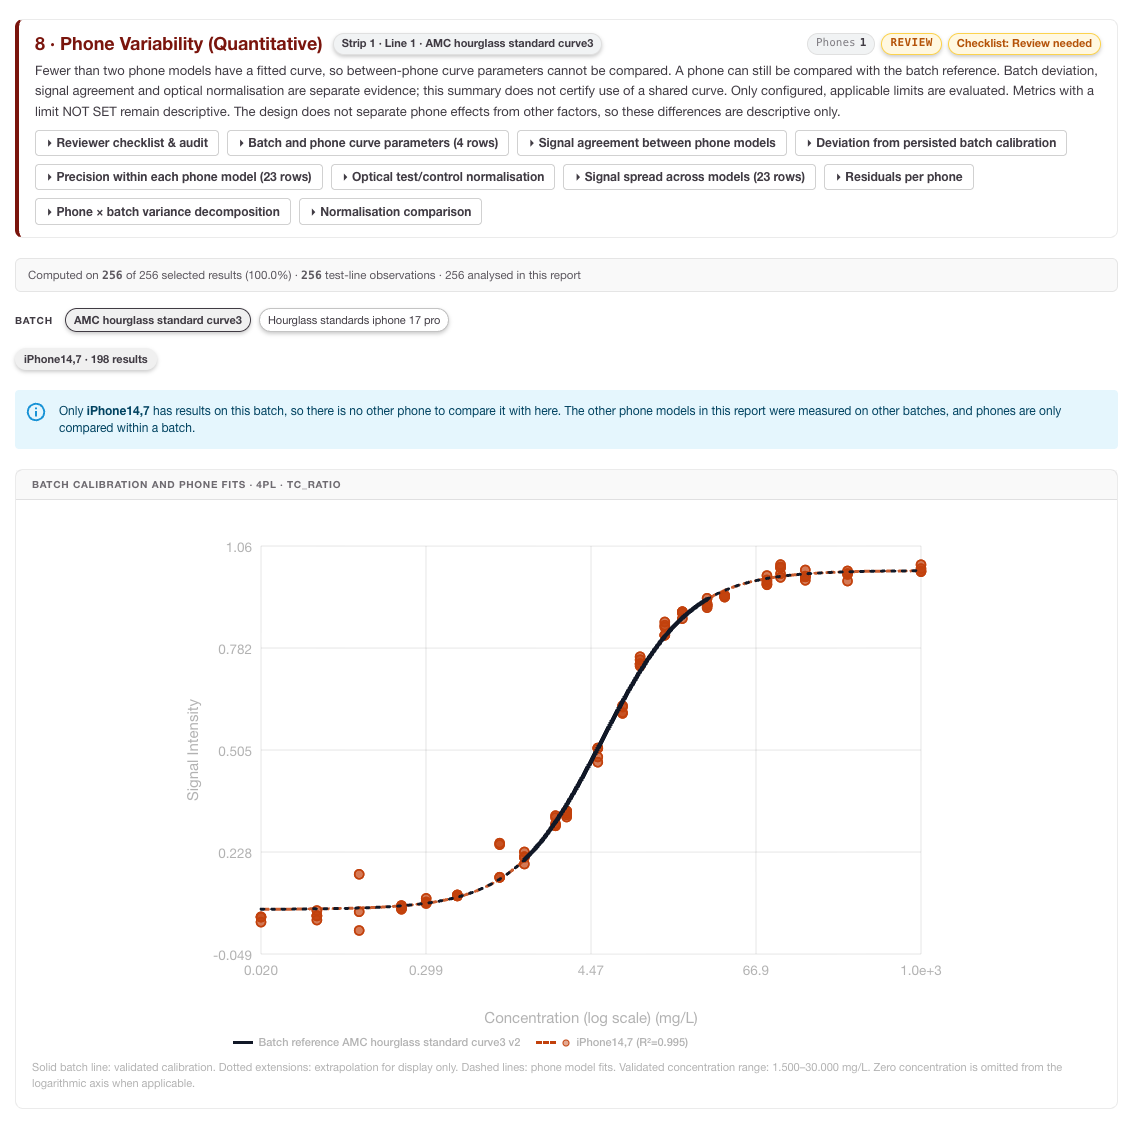
This section evaluates quantitative signal behaviour by phone model within each batch and test line. It may include independent 4PL, 5PL or linear fits per phone, curve overlays, parameter summaries, concentration-level mean/SD/CV%, residual summaries, variance components and comparisons with the selected batch calibration reference.
How to interpret it: Look for phone-specific curve shape differences, concentration-level CV changes and residual bias. A phone can show acceptable qualitative performance while still having a measurable quantitative offset that matters for future calibration or correction strategies.
Limitation: Section 8 does not establish phone equivalence, validate a shared calibration curve or implement per-device curve correction. It provides evidence for review and further study design.
Spreadsheet follow-up: Plot signal, T/C ratio and residuals by phone and concentration. Compare before/after or processed-signal versus T/C-ratio CV where available, but do not treat a CV reduction as validation of a deployed correction unless that study was explicitly designed and controlled.
9 · Phone Effect & Equivalence
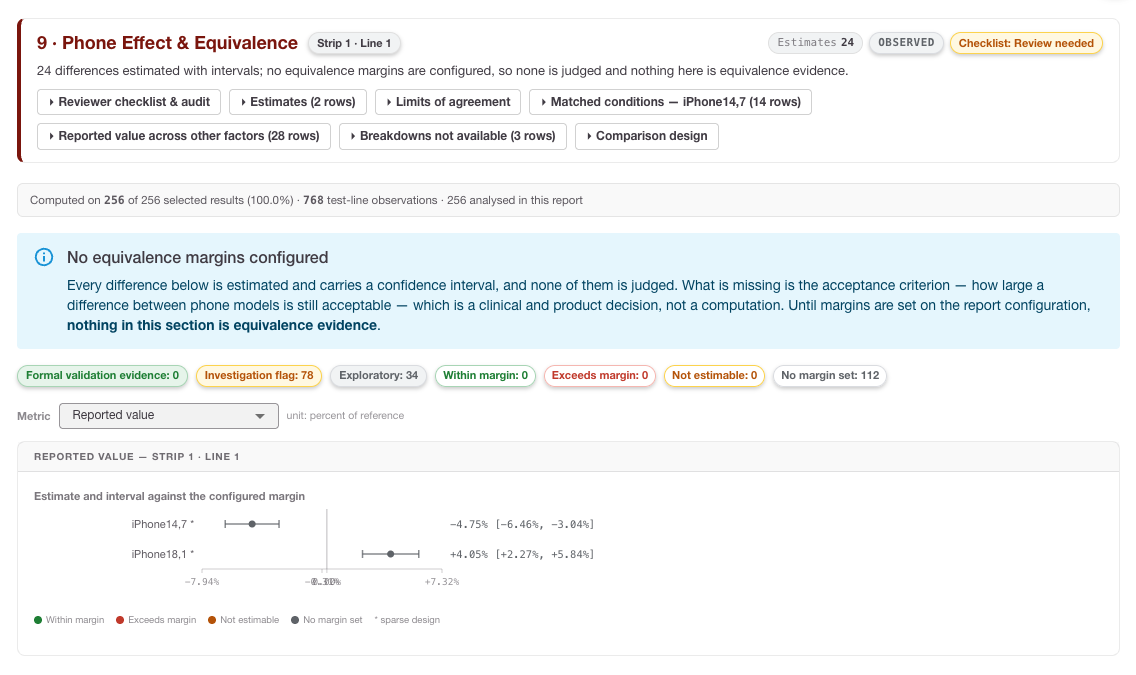
This section calculates phone-model effect estimates against either a configured reference phone model or the other phone models pooled. It reports the estimate, units, sample counts, 95% confidence interval and comparison with saved lower and/or upper metric bounds.
Status values may include:
-
within_margin: the reported interval lies within the configured numerical bounds.
-
exceeds_margin: the estimate or interval crosses a configured bound.
-
not_estimable: the estimate or interval cannot be calculated.
-
not configured: no applicable margin was saved before report generation.
How to interpret it: Treat this as numerical margin comparison evidence, not a standalone equivalence certificate. Check the reference group, units, comparison population, sample counts and whether margins were configured before generation.
Limitation: The Portal does not comprehensively validate every comparison-specific design eligibility condition. Terms such as “formal_validation”, “within_margin”, “Equivalence demonstrated” or a summary PASS must not be treated as sufficient proof of device equivalence without study-design review.
Spreadsheet follow-up: Recreate forest-plot tables and flag comparisons with sparse counts, one-sided margins, disjoint batches or unresolved not-estimable rows. Use these flags to plan a better crossed phone × batch × concentration study if formal equivalence evidence is needed.
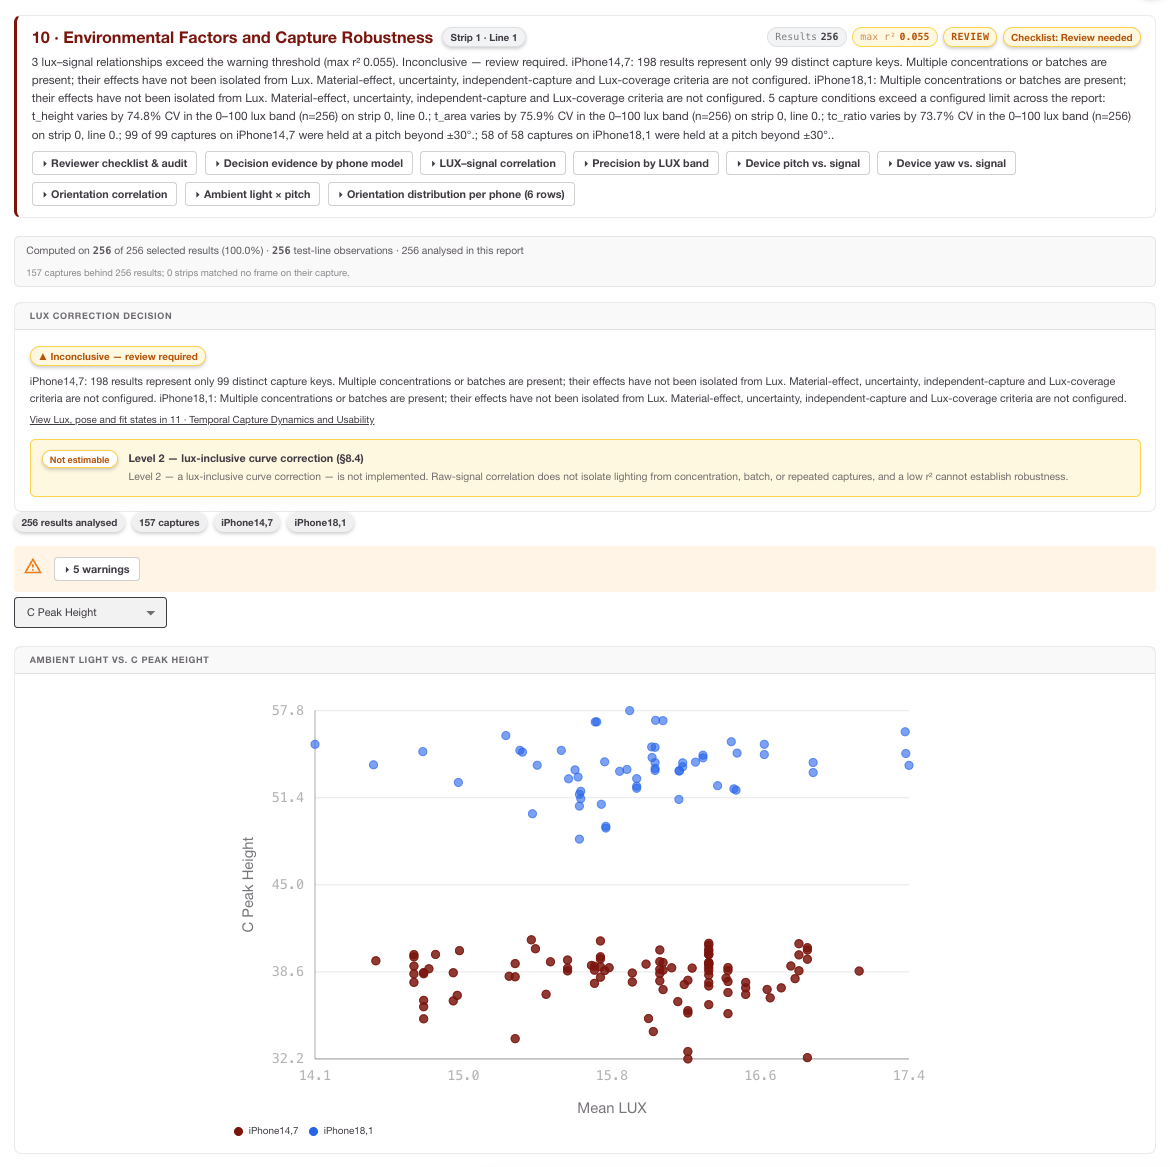
10 · Environmental Factors and Capture Robustness
This section explores associations between capture conditions and signal measurements. It can include lux versus signal plots, pitch/yaw versus signal plots, Pearson and Spearman correlations, lux-banded precision and counts of excluded records without usable telemetry.
How to interpret it: Use this section to identify potential robustness issues, not to claim validated environmental robustness. Correlations may reflect concentration, batch or phone differences rather than a direct environmental effect. Always check telemetry missingness first.
Limitation: Environmental analysis is exploratory and not adjusted for all batch or concentration effects. Default environmental thresholds may be applied by the backend when explicit configuration is absent; this does not prove that the limits were user-selected or validated acceptance criteria.
Spreadsheet follow-up: Export telemetry and signal fields, then stratify by concentration, batch and phone before interpreting a lux or orientation trend. If a high-lux band appears worse, check whether it also contains a different phone or batch mix.
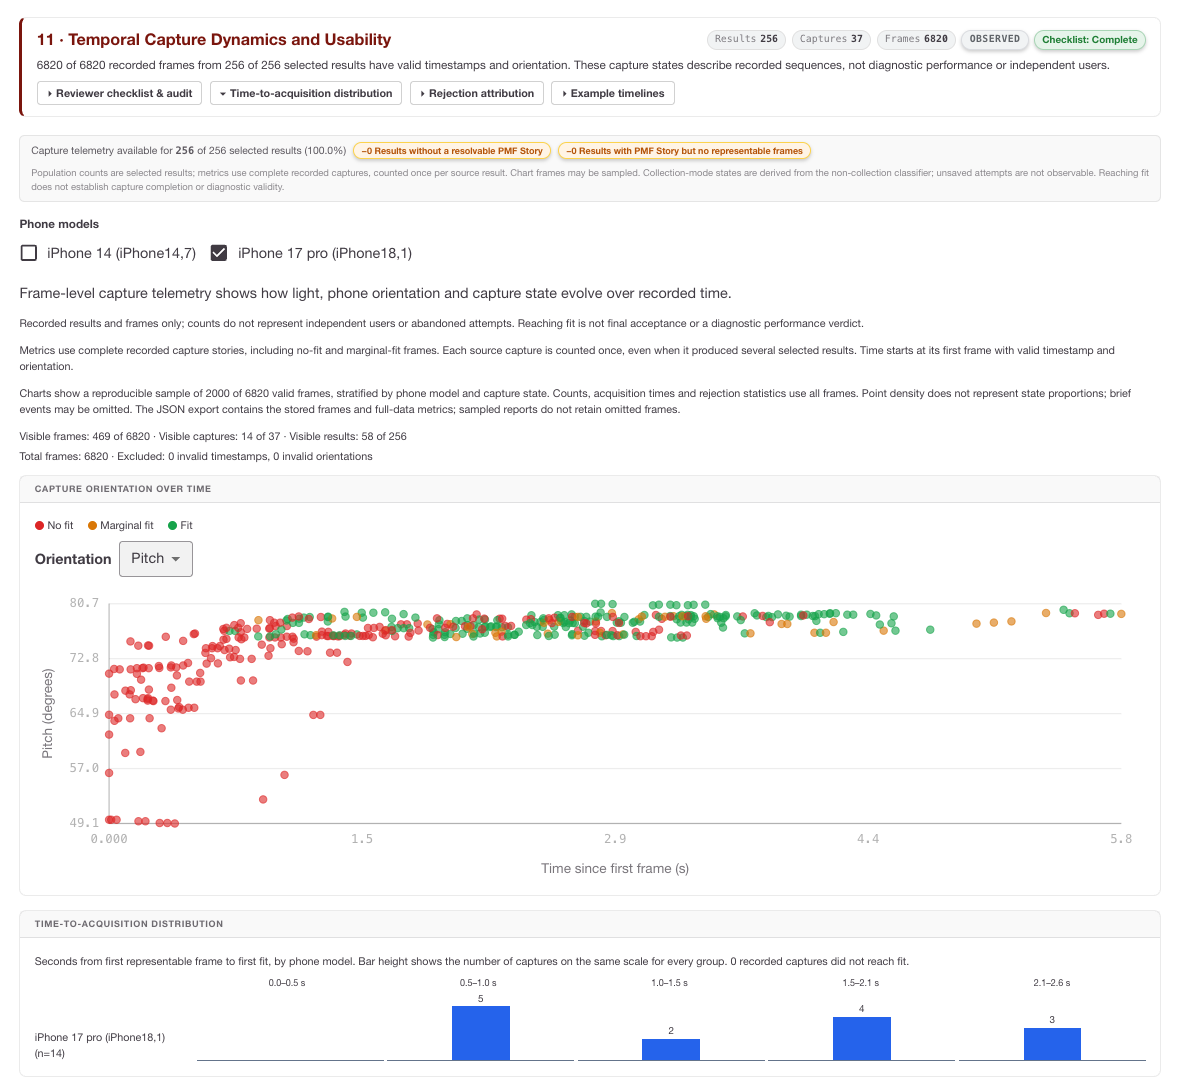
11 · Temporal Capture Dynamics and Usability
This section uses PMF story timing and telemetry to visualise capture dynamics. It can show frame state, orientation and lux over capture time, along with capture identity, telemetry provenance, selected result counts, distinct capture counts and frame counts.
How to interpret it: Use temporal plots to spot capture instability, orientation drift, abrupt lux changes, repeated marginal frames or patterns that suggest usability issues. These metrics describe recorded captures, not abandoned attempts or independent user behaviour unless those data were explicitly captured.
Spreadsheet follow-up: For usability investigations, group frames by capture ID and compare duration, frame count, fit state, pitch/yaw variation and lux variation. Avoid treating every frame as an independent sample when it comes from the same capture story.
Calibration fitting failures and inspection
When a recognised fit failure occurs, the report should isolate the failure to the affected phone model or analysis slice, preserve independent outputs, and mark fit-dependent outputs as unavailable with a reason.
If underlying calibrator concentration-versus-signal points are available, the user can inspect them as a scatter plot without a fitted curve. This helps distinguish data-quality or concentration-response anomalies from transport or request errors.
A converged fit with finite parameters is not automatically proof of model identifiability. Non-estimable parameter uncertainty and ill-conditioned fits still require expert review.
Viewing or editing an existing report configuration
Open an existing report configuration when you need to inspect settings, regenerate a report or create a new version.
-
View report: opens the generated report view for metrics, charts and result breakdowns.
-
Save as a new version: use this when you need to change dataset, classifier, batch group, sections or limits while preserving the previous configuration.
-
Generate or regenerate: runs the analysis using the saved settings.
-
Verify lineage: confirm the configuration version, dataset ID, classifier version, batch version and RARE Portal version before using results in a validation or QC record.
After generating a report
After a report is generated:
-
Start with scope: verify provenance, dataset, test-line, classifier split, phone models and generation time.
-
Review population accounting: ensure analysed counts, missingness and sparse design cells support the intended interpretation.
-
Read section limitations: especially for phone equivalence, environmental analysis and temporal usability outputs.
-
Export the PDF: keep a human-readable record with charts, tables, contents and running headers.
-
Export tables where available: use spreadsheet analysis to investigate denominators, outliers, sparse cells and subgroup effects.
-
Protect data integrity: report generation does not rewrite original stored measurements; it creates an analysis snapshot from selected data and configuration versions.
Appendices
The following appendices provide the proposed calculation models for the report sections added or expanded for population accounting, phone variability, phone-effect margin comparison, environmental robustness and temporal usability. They are intended to make the report calculations transparent for LF manufacturing, QC and laboratory users, and to support independent review in exported tabular data where those fields are available.
Usage note: When using exported data, keep report ID, dataset ID, result ID, phone model, batch ID, classifier version and configuration version with every calculation so that any spreadsheet-derived result remains traceable to the generated report.
Appendix A · Section 1.1 Population Accounting calculations
Purpose: Use these calculations to audit how many records move from capture to analysis, and to identify whether missing metadata or sparse design cells limit interpretation.
Funnel stage yield and overall retention
For each population-accounting stage:
Overall retention from capture to analysis is:
Where: N_k is the record count at funnel stage k, for example Captured → Selected → Ground-truth linked → Technically valid → Analysed.
Interpretation: A large fall between Captured and Selected usually indicates filter or configuration exclusion. A fall between Technically valid and Analysed can indicate missing analytical signal, failed peak detection or another fit-dependent exclusion. Do not interpret later performance metrics without first checking which records were removed.
Spreadsheet check: =(CurrentStageCount / PreviousStageCount) * 100
Field-level missingness rate
'%3e%3cg transform='translate(167%2c0)'%3e%3cg transform='translate(-13%2c0)'%3e%3cg transform='translate(0%2c-8)'%3e%3cuse xlink:href='%23MJMATHI-4D' x='0' y='0'%3e%3c/use%3e%3cuse transform='scale(0.707)' xlink:href='%23MJMATHI-6A' x='1372' y='-213'%3e%3c/use%3e%3cuse xlink:href='%23MJMAIN-3D' x='1639' y='0'%3e%3c/use%3e%3cg transform='translate(2696%2c0)'%3e%3cuse xlink:href='%23MJSZ3-28'%3e%3c/use%3e%3cg transform='translate(736%2c0)'%3e%3cg transform='translate(120%2c0)'%3e%3crect stroke='none' width='3800' height='60' x='0' y='220'%3e%3c/rect%3e%3cg transform='translate(60%2c782)'%3e%3cuse xlink:href='%23MJMATHI-4E' x='0' y='0'%3e%3c/use%3e%3cg transform='translate(803%2c-150)'%3e%3cuse transform='scale(0.707)' xlink:href='%23MJMAIN-6D'%3e%3c/use%3e%3cuse transform='scale(0.707)' xlink:href='%23MJMAIN-69' x='833' y='0'%3e%3c/use%3e%3cuse transform='scale(0.707)' xlink:href='%23MJMAIN-73' x='1112' y='0'%3e%3c/use%3e%3cuse transform='scale(0.707)' xlink:href='%23MJMAIN-73' x='1506' y='0'%3e%3c/use%3e%3cuse transform='scale(0.707)' xlink:href='%23MJMAIN-69' x='1901' y='0'%3e%3c/use%3e%3cuse transform='scale(0.707)' xlink:href='%23MJMAIN-6E' x='2179' y='0'%3e%3c/use%3e%3cuse transform='scale(0.707)' xlink:href='%23MJMAIN-67' x='2736' y='0'%3e%3c/use%3e%3cuse transform='scale(0.707)' xlink:href='%23MJMAIN-2C' x='3236' y='0'%3e%3c/use%3e%3cuse transform='scale(0.707)' xlink:href='%23MJMATHI-6A' x='3515' y='0'%3e%3c/use%3e%3c/g%3e%3c/g%3e%3cg transform='translate(720%2c-686)'%3e%3cuse xlink:href='%23MJMATHI-4E' x='0' y='0'%3e%3c/use%3e%3cg transform='translate(803%2c-150)'%3e%3cuse transform='scale(0.707)' xlink:href='%23MJMAIN-74'%3e%3c/use%3e%3cuse transform='scale(0.707)' xlink:href='%23MJMAIN-6F' x='389' y='0'%3e%3c/use%3e%3cuse transform='scale(0.707)' xlink:href='%23MJMAIN-74' x='890' y='0'%3e%3c/use%3e%3cuse transform='scale(0.707)' xlink:href='%23MJMAIN-61' x='1279' y='0'%3e%3c/use%3e%3cuse transform='scale(0.707)' xlink:href='%23MJMAIN-6C' x='1780' y='0'%3e%3c/use%3e%3c/g%3e%3c/g%3e%3c/g%3e%3c/g%3e%3cuse xlink:href='%23MJSZ3-29' x='4777' y='-1'%3e%3c/use%3e%3c/g%3e%3cuse xlink:href='%23MJMAIN-D7' x='8432' y='0'%3e%3c/use%3e%3cg transform='translate(9432%2c0)'%3e%3cuse xlink:href='%23MJMAIN-31'%3e%3c/use%3e%3cuse xlink:href='%23MJMAIN-30' x='500' y='0'%3e%3c/use%3e%3cuse xlink:href='%23MJMAIN-30' x='1001' y='0'%3e%3c/use%3e%3c/g%3e%3c/g%3e%3c/g%3e%3c/g%3e%3c/g%3e%3c/svg%3e)
Where: M_j is the missingness rate for field j, such as ground truth, signal, image, capture status, lux, pitch or yaw.
Interpretation: High missingness in telemetry fields weakens environmental and usability conclusions. For example, if lux is missing for many records, Section 10 should be treated as exploratory even when a plot is shown.
Spreadsheet check: =(MissingFieldCount / TotalRecordCount) * 100
Design-crossing sparse-cell flag
'%3e%3cg transform='translate(167%2c0)'%3e%3cg transform='translate(-13%2c0)'%3e%3cuse xlink:href='%23MJMAIN-46'%3e%3c/use%3e%3cuse xlink:href='%23MJMAIN-6C' x='653' y='0'%3e%3c/use%3e%3cuse xlink:href='%23MJMAIN-61' x='932' y='0'%3e%3c/use%3e%3cuse xlink:href='%23MJMAIN-67' x='1432' y='0'%3e%3c/use%3e%3cg transform='translate(1933%2c-243)'%3e%3cuse transform='scale(0.707)' xlink:href='%23MJMAIN-73'%3e%3c/use%3e%3cuse transform='scale(0.707)' xlink:href='%23MJMAIN-70' x='394' y='0'%3e%3c/use%3e%3cuse transform='scale(0.707)' xlink:href='%23MJMAIN-61' x='951' y='0'%3e%3c/use%3e%3cuse transform='scale(0.707)' xlink:href='%23MJMAIN-72' x='1451' y='0'%3e%3c/use%3e%3cuse transform='scale(0.707)' xlink:href='%23MJMAIN-73' x='1844' y='0'%3e%3c/use%3e%3cuse transform='scale(0.707)' xlink:href='%23MJMAIN-65' x='2238' y='0'%3e%3c/use%3e%3c/g%3e%3cuse xlink:href='%23MJMAIN-3D' x='4207' y='0'%3e%3c/use%3e%3cg transform='translate(5264%2c0)'%3e%3cuse xlink:href='%23MJSZ3-7B'%3e%3c/use%3e%3cg transform='translate(917%2c0)'%3e%3cg transform='translate(-13%2c0)'%3e%3cg transform='translate(0%2c644)'%3e%3cuse xlink:href='%23MJMAIN-54'%3e%3c/use%3e%3cuse xlink:href='%23MJMAIN-52' x='722' y='0'%3e%3c/use%3e%3cuse xlink:href='%23MJMAIN-55' x='1459' y='0'%3e%3c/use%3e%3cuse xlink:href='%23MJMAIN-45' x='2209' y='0'%3e%3c/use%3e%3cuse xlink:href='%23MJMAIN-2C' x='2891' y='0'%3e%3c/use%3e%3c/g%3e%3cg transform='translate(0%2c-650)'%3e%3cuse xlink:href='%23MJMAIN-46'%3e%3c/use%3e%3cuse xlink:href='%23MJMAIN-41' x='653' y='0'%3e%3c/use%3e%3cuse xlink:href='%23MJMAIN-4C' x='1404' y='0'%3e%3c/use%3e%3cuse xlink:href='%23MJMAIN-53' x='2029' y='0'%3e%3c/use%3e%3cuse xlink:href='%23MJMAIN-45' x='2586' y='0'%3e%3c/use%3e%3cuse xlink:href='%23MJMAIN-2C' x='3267' y='0'%3e%3c/use%3e%3c/g%3e%3c/g%3e%3cg transform='translate(4533%2c0)'%3e%3cg transform='translate(0%2c644)'%3e%3cuse xlink:href='%23MJMATHI-4E' x='0' y='0'%3e%3c/use%3e%3cg transform='translate(803%2c-150)'%3e%3cuse transform='scale(0.707)' xlink:href='%23MJMATHI-69' x='0' y='0'%3e%3c/use%3e%3cuse transform='scale(0.707)' xlink:href='%23MJMATHI-6A' x='345' y='0'%3e%3c/use%3e%3cuse transform='scale(0.707)' xlink:href='%23MJMATHI-6B' x='758' y='0'%3e%3c/use%3e%3c/g%3e%3cuse xlink:href='%23MJMAIN-3C' x='2086' y='0'%3e%3c/use%3e%3cuse xlink:href='%23MJMAIN-33' x='3142' y='0'%3e%3c/use%3e%3c/g%3e%3cg transform='translate(0%2c-650)'%3e%3cuse xlink:href='%23MJMATHI-4E' x='0' y='0'%3e%3c/use%3e%3cg transform='translate(803%2c-150)'%3e%3cuse transform='scale(0.707)' xlink:href='%23MJMATHI-69' x='0' y='0'%3e%3c/use%3e%3cuse transform='scale(0.707)' xlink:href='%23MJMATHI-6A' x='345' y='0'%3e%3c/use%3e%3cuse transform='scale(0.707)' xlink:href='%23MJMATHI-6B' x='758' y='0'%3e%3c/use%3e%3c/g%3e%3cuse xlink:href='%23MJMAIN-2265' x='2086' y='0'%3e%3c/use%3e%3cuse xlink:href='%23MJMAIN-33' x='3142' y='0'%3e%3c/use%3e%3c/g%3e%3c/g%3e%3c/g%3e%3c/g%3e%3c/g%3e%3c/g%3e%3c/g%3e%3c/svg%3e)
Where: N_ijk is the number of records in a phone model × batch × concentration or class cell.
Interpretation: Cells with fewer than three observations should normally be treated as descriptive rather than confirmatory. A phone comparison is especially fragile if each phone appears in different batches or concentration levels.
Spreadsheet check: =IF(CellCount<3,"Sparse cell","OK")
Appendix B · Section 7 Phone Variability: Qualitative Performance and Threshold Stability calculations
Purpose: Use these calculations to compare qualitative diagnostic behaviour by phone model and to assess whether the decision threshold appears stable across supported devices.
Per-phone false-positive and false-negative rates
'%3e%3cg transform='translate(167%2c0)'%3e%3cg transform='translate(-13%2c0)'%3e%3cg transform='translate(0%2c7)'%3e%3cuse xlink:href='%23MJMAIN-46'%3e%3c/use%3e%3cuse xlink:href='%23MJMAIN-50' x='653' y='0'%3e%3c/use%3e%3cuse xlink:href='%23MJMAIN-52' x='1335' y='0'%3e%3c/use%3e%3cuse transform='scale(0.707)' xlink:href='%23MJMATHI-70' x='2929' y='-213'%3e%3c/use%3e%3cuse xlink:href='%23MJMAIN-3D' x='2805' y='0'%3e%3c/use%3e%3cg transform='translate(3583%2c0)'%3e%3cg transform='translate(397%2c0)'%3e%3crect stroke='none' width='5155' height='60' x='0' y='220'%3e%3c/rect%3e%3cg transform='translate(1653%2c774)'%3e%3cuse xlink:href='%23MJMATHI-46' x='0' y='0'%3e%3c/use%3e%3cg transform='translate(749%2c0)'%3e%3cuse xlink:href='%23MJMATHI-50' x='0' y='0'%3e%3c/use%3e%3cuse transform='scale(0.707)' xlink:href='%23MJMATHI-70' x='908' y='-213'%3e%3c/use%3e%3c/g%3e%3c/g%3e%3cg transform='translate(60%2c-686)'%3e%3cuse xlink:href='%23MJMATHI-54' x='0' y='0'%3e%3c/use%3e%3cg transform='translate(704%2c0)'%3e%3cuse xlink:href='%23MJMATHI-4E' x='0' y='0'%3e%3c/use%3e%3cuse transform='scale(0.707)' xlink:href='%23MJMATHI-70' x='1136' y='-213'%3e%3c/use%3e%3c/g%3e%3cuse xlink:href='%23MJMAIN-2B' x='2186' y='0'%3e%3c/use%3e%3cuse xlink:href='%23MJMATHI-46' x='3186' y='0'%3e%3c/use%3e%3cg transform='translate(3936%2c0)'%3e%3cuse xlink:href='%23MJMATHI-50' x='0' y='0'%3e%3c/use%3e%3cuse transform='scale(0.707)' xlink:href='%23MJMATHI-70' x='908' y='-213'%3e%3c/use%3e%3c/g%3e%3c/g%3e%3c/g%3e%3c/g%3e%3cuse xlink:href='%23MJMAIN-3D' x='9534' y='0'%3e%3c/use%3e%3cuse xlink:href='%23MJMAIN-31' x='10590' y='0'%3e%3c/use%3e%3cuse xlink:href='%23MJMAIN-2212' x='11313' y='0'%3e%3c/use%3e%3cg transform='translate(12314%2c0)'%3e%3cuse xlink:href='%23MJMAIN-53'%3e%3c/use%3e%3cuse xlink:href='%23MJMAIN-70' x='556' y='0'%3e%3c/use%3e%3cuse xlink:href='%23MJMAIN-65' x='1113' y='0'%3e%3c/use%3e%3cuse xlink:href='%23MJMAIN-63' x='1557' y='0'%3e%3c/use%3e%3cuse xlink:href='%23MJMAIN-69' x='2002' y='0'%3e%3c/use%3e%3cuse xlink:href='%23MJMAIN-66' x='2280' y='0'%3e%3c/use%3e%3cuse xlink:href='%23MJMAIN-69' x='2587' y='0'%3e%3c/use%3e%3cuse xlink:href='%23MJMAIN-63' x='2865' y='0'%3e%3c/use%3e%3cuse xlink:href='%23MJMAIN-69' x='3310' y='0'%3e%3c/use%3e%3cuse xlink:href='%23MJMAIN-74' x='3588' y='0'%3e%3c/use%3e%3cuse xlink:href='%23MJMAIN-79' x='3978' y='0'%3e%3c/use%3e%3cuse transform='scale(0.707)' xlink:href='%23MJMATHI-70' x='6373' y='-340'%3e%3c/use%3e%3c/g%3e%3c/g%3e%3c/g%3e%3c/g%3e%3c/g%3e%3c/svg%3e)
'%3e%3cg transform='translate(167%2c0)'%3e%3cg transform='translate(-13%2c0)'%3e%3cg transform='translate(0%2c7)'%3e%3cuse xlink:href='%23MJMAIN-46'%3e%3c/use%3e%3cuse xlink:href='%23MJMAIN-4E' x='653' y='0'%3e%3c/use%3e%3cuse xlink:href='%23MJMAIN-52' x='1404' y='0'%3e%3c/use%3e%3cuse transform='scale(0.707)' xlink:href='%23MJMATHI-70' x='3027' y='-213'%3e%3c/use%3e%3cuse xlink:href='%23MJMAIN-3D' x='2874' y='0'%3e%3c/use%3e%3cg transform='translate(3652%2c0)'%3e%3cg transform='translate(397%2c0)'%3e%3crect stroke='none' width='5155' height='60' x='0' y='220'%3e%3c/rect%3e%3cg transform='translate(1572%2c774)'%3e%3cuse xlink:href='%23MJMATHI-46' x='0' y='0'%3e%3c/use%3e%3cg transform='translate(749%2c0)'%3e%3cuse xlink:href='%23MJMATHI-4E' x='0' y='0'%3e%3c/use%3e%3cuse transform='scale(0.707)' xlink:href='%23MJMATHI-70' x='1136' y='-213'%3e%3c/use%3e%3c/g%3e%3c/g%3e%3cg transform='translate(60%2c-686)'%3e%3cuse xlink:href='%23MJMATHI-54' x='0' y='0'%3e%3c/use%3e%3cg transform='translate(704%2c0)'%3e%3cuse xlink:href='%23MJMATHI-50' x='0' y='0'%3e%3c/use%3e%3cuse transform='scale(0.707)' xlink:href='%23MJMATHI-70' x='908' y='-213'%3e%3c/use%3e%3c/g%3e%3cuse xlink:href='%23MJMAIN-2B' x='2025' y='0'%3e%3c/use%3e%3cuse xlink:href='%23MJMATHI-46' x='3025' y='0'%3e%3c/use%3e%3cg transform='translate(3775%2c0)'%3e%3cuse xlink:href='%23MJMATHI-4E' x='0' y='0'%3e%3c/use%3e%3cuse transform='scale(0.707)' xlink:href='%23MJMATHI-70' x='1136' y='-213'%3e%3c/use%3e%3c/g%3e%3c/g%3e%3c/g%3e%3c/g%3e%3cuse xlink:href='%23MJMAIN-3D' x='9603' y='0'%3e%3c/use%3e%3cuse xlink:href='%23MJMAIN-31' x='10659' y='0'%3e%3c/use%3e%3cuse xlink:href='%23MJMAIN-2212' x='11382' y='0'%3e%3c/use%3e%3cg transform='translate(12383%2c0)'%3e%3cuse xlink:href='%23MJMAIN-53'%3e%3c/use%3e%3cuse xlink:href='%23MJMAIN-65' x='556' y='0'%3e%3c/use%3e%3cuse xlink:href='%23MJMAIN-6E' x='1001' y='0'%3e%3c/use%3e%3cuse xlink:href='%23MJMAIN-73' x='1557' y='0'%3e%3c/use%3e%3cuse xlink:href='%23MJMAIN-69' x='1952' y='0'%3e%3c/use%3e%3cuse xlink:href='%23MJMAIN-74' x='2230' y='0'%3e%3c/use%3e%3cuse xlink:href='%23MJMAIN-69' x='2620' y='0'%3e%3c/use%3e%3cuse xlink:href='%23MJMAIN-76' x='2898' y='0'%3e%3c/use%3e%3cuse xlink:href='%23MJMAIN-69' x='3427' y='0'%3e%3c/use%3e%3cuse xlink:href='%23MJMAIN-74' x='3705' y='0'%3e%3c/use%3e%3cuse xlink:href='%23MJMAIN-79' x='4095' y='0'%3e%3c/use%3e%3cuse transform='scale(0.707)' xlink:href='%23MJMATHI-70' x='6538' y='-340'%3e%3c/use%3e%3c/g%3e%3c/g%3e%3c/g%3e%3c/g%3e%3c/g%3e%3c/svg%3e)
Where: subscript p denotes a specific phone model. TP, TN, FP and FN are counted separately for that phone.
Interpretation: For screening uses, compare FNR_p carefully because false negatives may be the critical risk. For confirmatory uses, compare FPR_p. Always read the numerator and denominator, not only the percentage.
Spreadsheet check: =FP/(TN+FP) and =FN/(TP+FN)
Wilson score confidence interval for proportions
'%3e%3cg transform='translate(167%2c0)'%3e%3cg transform='translate(-13%2c0)'%3e%3cg transform='translate(0%2c-272)'%3e%3cuse xlink:href='%23MJMAIN-43'%3e%3c/use%3e%3cuse xlink:href='%23MJMAIN-49' x='722' y='0'%3e%3c/use%3e%3cg transform='translate(1084%2c-187)'%3e%3cuse transform='scale(0.707)' xlink:href='%23MJMAIN-39'%3e%3c/use%3e%3cuse transform='scale(0.707)' xlink:href='%23MJMAIN-35' x='500' y='0'%3e%3c/use%3e%3cuse transform='scale(0.707)' xlink:href='%23MJMAIN-25' x='1001' y='0'%3e%3c/use%3e%3c/g%3e%3cuse xlink:href='%23MJMAIN-3D' x='2758' y='0'%3e%3c/use%3e%3cg transform='translate(3537%2c0)'%3e%3cg transform='translate(397%2c0)'%3e%3crect stroke='none' width='11132' height='60' x='0' y='220'%3e%3c/rect%3e%3cg transform='translate(60%2c1039)'%3e%3cuse xlink:href='%23MJMATHI-70' x='0' y='0'%3e%3c/use%3e%3cuse xlink:href='%23MJMAIN-5E' x='84' y='1'%3e%3c/use%3e%3cuse xlink:href='%23MJMAIN-2B' x='807' y='0'%3e%3c/use%3e%3cg transform='translate(1586%2c0)'%3e%3cg transform='translate(342%2c0)'%3e%3crect stroke='none' width='898' height='60' x='0' y='220'%3e%3c/rect%3e%3cg transform='translate(122%2c428)'%3e%3cuse transform='scale(0.707)' xlink:href='%23MJMATHI-7A' x='0' y='0'%3e%3c/use%3e%3cuse transform='scale(0.5)' xlink:href='%23MJMAIN-32' x='663' y='513'%3e%3c/use%3e%3c/g%3e%3cg transform='translate(60%2c-392)'%3e%3cuse transform='scale(0.707)' xlink:href='%23MJMAIN-32' x='0' y='0'%3e%3c/use%3e%3cuse transform='scale(0.707)' xlink:href='%23MJMATHI-6E' x='500' y='0'%3e%3c/use%3e%3c/g%3e%3c/g%3e%3c/g%3e%3cuse xlink:href='%23MJMAIN-B1' x='3168' y='0'%3e%3c/use%3e%3cuse xlink:href='%23MJMATHI-7A' x='4169' y='0'%3e%3c/use%3e%3cg transform='translate(4638%2c0)'%3e%3cuse xlink:href='%23MJSZ2-221A' x='0' y='97'%3e%3c/use%3e%3crect stroke='none' width='5374' height='60' x='1000' y='1188'%3e%3c/rect%3e%3cg transform='translate(1000%2c0)'%3e%3cg transform='translate(120%2c0)'%3e%3crect stroke='none' width='2451' height='60' x='0' y='220'%3e%3c/rect%3e%3cg transform='translate(60%2c597)'%3e%3cuse transform='scale(0.707)' xlink:href='%23MJMATHI-70' x='0' y='0'%3e%3c/use%3e%3cuse transform='scale(0.707)' xlink:href='%23MJMAIN-5E' x='119' y='37'%3e%3c/use%3e%3cuse transform='scale(0.707)' xlink:href='%23MJMAIN-28' x='619' y='0'%3e%3c/use%3e%3cuse transform='scale(0.707)' xlink:href='%23MJMAIN-31' x='1009' y='0'%3e%3c/use%3e%3cuse transform='scale(0.707)' xlink:href='%23MJMAIN-2212' x='1509' y='0'%3e%3c/use%3e%3cg transform='translate(1618%2c0)'%3e%3cuse transform='scale(0.707)' xlink:href='%23MJMATHI-70' x='0' y='0'%3e%3c/use%3e%3cuse transform='scale(0.707)' xlink:href='%23MJMAIN-5E' x='119' y='37'%3e%3c/use%3e%3c/g%3e%3cuse transform='scale(0.707)' xlink:href='%23MJMAIN-29' x='2908' y='0'%3e%3c/use%3e%3c/g%3e%3cuse transform='scale(0.707)' xlink:href='%23MJMATHI-6E' x='1433' y='-488'%3e%3c/use%3e%3c/g%3e%3cuse xlink:href='%23MJMAIN-2B' x='2913' y='0'%3e%3c/use%3e%3cg transform='translate(3692%2c0)'%3e%3cg transform='translate(342%2c0)'%3e%3crect stroke='none' width='1219' height='60' x='0' y='220'%3e%3c/rect%3e%3cg transform='translate(283%2c428)'%3e%3cuse transform='scale(0.707)' xlink:href='%23MJMATHI-7A' x='0' y='0'%3e%3c/use%3e%3cuse transform='scale(0.5)' xlink:href='%23MJMAIN-32' x='663' y='408'%3e%3c/use%3e%3c/g%3e%3cg transform='translate(60%2c-458)'%3e%3cuse transform='scale(0.707)' xlink:href='%23MJMAIN-34' x='0' y='0'%3e%3c/use%3e%3cg transform='translate(353%2c0)'%3e%3cuse transform='scale(0.707)' xlink:href='%23MJMATHI-6E' x='0' y='0'%3e%3c/use%3e%3cuse transform='scale(0.5)' xlink:href='%23MJMAIN-32' x='849' y='408'%3e%3c/use%3e%3c/g%3e%3c/g%3e%3c/g%3e%3c/g%3e%3c/g%3e%3c/g%3e%3c/g%3e%3cg transform='translate(4198%2c-952)'%3e%3cuse xlink:href='%23MJMAIN-31' x='0' y='0'%3e%3c/use%3e%3cuse xlink:href='%23MJMAIN-2B' x='722' y='0'%3e%3c/use%3e%3cg transform='translate(1501%2c0)'%3e%3cg transform='translate(342%2c0)'%3e%3crect stroke='none' width='772' height='60' x='0' y='220'%3e%3c/rect%3e%3cg transform='translate(60%2c428)'%3e%3cuse transform='scale(0.707)' xlink:href='%23MJMATHI-7A' x='0' y='0'%3e%3c/use%3e%3cuse transform='scale(0.5)' xlink:href='%23MJMAIN-32' x='663' y='408'%3e%3c/use%3e%3c/g%3e%3cuse transform='scale(0.707)' xlink:href='%23MJMATHI-6E' x='246' y='-488'%3e%3c/use%3e%3c/g%3e%3c/g%3e%3c/g%3e%3c/g%3e%3c/g%3e%3c/g%3e%3c/g%3e%3c/g%3e%3c/g%3e%3c/svg%3e)
Where: p̂ is the observed proportion, such as sensitivity, specificity or accuracy; n is the relevant denominator; and z = 1.96 for an approximate 95% confidence interval.
Interpretation: Wilson intervals are more reliable than simple normal intervals when denominators are small or proportions are close to 0% or 100%. If phone confidence intervals are wide and overlapping, apparent rank ordering between phones may not be meaningful.
Optimal-threshold instability across phone models
'%3e%3cg transform='translate(167%2c0)'%3e%3cg transform='translate(-13%2c0)'%3e%3cg transform='translate(0%2c30)'%3e%3cuse xlink:href='%23MJMAIN-25' x='0' y='0'%3e%3c/use%3e%3cg transform='translate(833%2c0)'%3e%3cuse xlink:href='%23MJMAIN-43'%3e%3c/use%3e%3cuse xlink:href='%23MJMAIN-56' x='722' y='0'%3e%3c/use%3e%3cg transform='translate(1473%2c-150)'%3e%3cuse transform='scale(0.707)' xlink:href='%23MJMATHI-54' x='0' y='0'%3e%3c/use%3e%3cg transform='translate(413%2c-107)'%3e%3cuse transform='scale(0.5)' xlink:href='%23MJMAIN-6F'%3e%3c/use%3e%3cuse transform='scale(0.5)' xlink:href='%23MJMAIN-70' x='500' y='0'%3e%3c/use%3e%3cuse transform='scale(0.5)' xlink:href='%23MJMAIN-74' x='1057' y='0'%3e%3c/use%3e%3c/g%3e%3c/g%3e%3c/g%3e%3cuse xlink:href='%23MJMAIN-3D' x='3891' y='0'%3e%3c/use%3e%3cg transform='translate(4947%2c0)'%3e%3cuse xlink:href='%23MJSZ3-28'%3e%3c/use%3e%3cg transform='translate(736%2c0)'%3e%3cg transform='translate(120%2c0)'%3e%3crect stroke='none' width='11846' height='60' x='0' y='220'%3e%3c/rect%3e%3cg transform='translate(60%2c774)'%3e%3cuse xlink:href='%23MJMAIN-53'%3e%3c/use%3e%3cuse xlink:href='%23MJMAIN-44' x='556' y='0'%3e%3c/use%3e%3cuse xlink:href='%23MJMAIN-28' x='1321' y='0'%3e%3c/use%3e%3cg transform='translate(1710%2c0)'%3e%3cuse xlink:href='%23MJMATHI-54' x='0' y='0'%3e%3c/use%3e%3cg transform='translate(584%2c-150)'%3e%3cuse transform='scale(0.707)' xlink:href='%23MJMAIN-6F'%3e%3c/use%3e%3cuse transform='scale(0.707)' xlink:href='%23MJMAIN-70' x='500' y='0'%3e%3c/use%3e%3cuse transform='scale(0.707)' xlink:href='%23MJMAIN-74' x='1057' y='0'%3e%3c/use%3e%3cuse transform='scale(0.707)' xlink:href='%23MJMAIN-2C' x='1446' y='0'%3e%3c/use%3e%3cuse transform='scale(0.707)' xlink:href='%23MJMAIN-31' x='1724' y='0'%3e%3c/use%3e%3c/g%3e%3c/g%3e%3cuse xlink:href='%23MJMAIN-2C' x='3968' y='0'%3e%3c/use%3e%3cg transform='translate(4413%2c0)'%3e%3cuse xlink:href='%23MJMATHI-54' x='0' y='0'%3e%3c/use%3e%3cg transform='translate(584%2c-150)'%3e%3cuse transform='scale(0.707)' xlink:href='%23MJMAIN-6F'%3e%3c/use%3e%3cuse transform='scale(0.707)' xlink:href='%23MJMAIN-70' x='500' y='0'%3e%3c/use%3e%3cuse transform='scale(0.707)' xlink:href='%23MJMAIN-74' x='1057' y='0'%3e%3c/use%3e%3cuse transform='scale(0.707)' xlink:href='%23MJMAIN-2C' x='1446' y='0'%3e%3c/use%3e%3cuse transform='scale(0.707)' xlink:href='%23MJMAIN-32' x='1724' y='0'%3e%3c/use%3e%3c/g%3e%3c/g%3e%3cuse xlink:href='%23MJMAIN-2C' x='6671' y='0'%3e%3c/use%3e%3cuse xlink:href='%23MJMAIN-2026' x='7117' y='0'%3e%3c/use%3e%3cuse xlink:href='%23MJMAIN-2C' x='8456' y='0'%3e%3c/use%3e%3cg transform='translate(8901%2c0)'%3e%3cuse xlink:href='%23MJMATHI-54' x='0' y='0'%3e%3c/use%3e%3cg transform='translate(584%2c-150)'%3e%3cuse transform='scale(0.707)' xlink:href='%23MJMAIN-6F'%3e%3c/use%3e%3cuse transform='scale(0.707)' xlink:href='%23MJMAIN-70' x='500' y='0'%3e%3c/use%3e%3cuse transform='scale(0.707)' xlink:href='%23MJMAIN-74' x='1057' y='0'%3e%3c/use%3e%3cuse transform='scale(0.707)' xlink:href='%23MJMAIN-2C' x='1446' y='0'%3e%3c/use%3e%3cuse transform='scale(0.707)' xlink:href='%23MJMATHI-50' x='1724' y='0'%3e%3c/use%3e%3c/g%3e%3c/g%3e%3cuse xlink:href='%23MJMAIN-29' x='11337' y='0'%3e%3c/use%3e%3c/g%3e%3cg transform='translate(4979%2c-800)'%3e%3cuse xlink:href='%23MJMATHI-54' x='0' y='0'%3e%3c/use%3e%3cuse xlink:href='%23MJMAIN-AF' x='263' y='222'%3e%3c/use%3e%3cg transform='translate(763%2c-150)'%3e%3cuse transform='scale(0.707)' xlink:href='%23MJMAIN-6F'%3e%3c/use%3e%3cuse transform='scale(0.707)' xlink:href='%23MJMAIN-70' x='500' y='0'%3e%3c/use%3e%3cuse transform='scale(0.707)' xlink:href='%23MJMAIN-74' x='1057' y='0'%3e%3c/use%3e%3c/g%3e%3c/g%3e%3c/g%3e%3c/g%3e%3cuse xlink:href='%23MJSZ3-29' x='12823' y='-1'%3e%3c/use%3e%3c/g%3e%3cuse xlink:href='%23MJMAIN-D7' x='18729' y='0'%3e%3c/use%3e%3cg transform='translate(19730%2c0)'%3e%3cuse xlink:href='%23MJMAIN-31'%3e%3c/use%3e%3cuse xlink:href='%23MJMAIN-30' x='500' y='0'%3e%3c/use%3e%3cuse xlink:href='%23MJMAIN-30' x='1001' y='0'%3e%3c/use%3e%3c/g%3e%3c/g%3e%3c/g%3e%3c/g%3e%3c/g%3e%3c/svg%3e)
Where: T_opt,p is the Youden-optimal threshold calculated independently for phone model p, and P is the number of phone models.
Interpretation: A high threshold CV suggests that the pooled operating threshold may not sit in an equally stable part of the response distribution for every phone. This does not by itself prove that phone-specific thresholds are required, but it is a useful trigger for review.
Spreadsheet check: =(STDEV.S(threshold_range)/AVERAGE(threshold_range))*100
Appendix C · Section 8 Phone Variability (Quantitative) calculations
Purpose: Use these models to describe phone-specific calibration behaviour, quantitative residuals and concentration-level precision.
Four-parameter logistic standard curve
'%3e%3cg transform='translate(167%2c0)'%3e%3cg transform='translate(-13%2c0)'%3e%3cg transform='translate(0%2c268)'%3e%3cuse xlink:href='%23MJMATHI-79' x='0' y='0'%3e%3c/use%3e%3cuse xlink:href='%23MJMAIN-3D' x='775' y='0'%3e%3c/use%3e%3cuse xlink:href='%23MJMATHI-64' x='1831' y='0'%3e%3c/use%3e%3cuse xlink:href='%23MJMAIN-2B' x='2577' y='0'%3e%3c/use%3e%3cg transform='translate(3355%2c0)'%3e%3cg transform='translate(342%2c0)'%3e%3crect stroke='none' width='3928' height='60' x='0' y='220'%3e%3c/rect%3e%3cg transform='translate(826%2c676)'%3e%3cuse xlink:href='%23MJMATHI-61' x='0' y='0'%3e%3c/use%3e%3cuse xlink:href='%23MJMAIN-2212' x='751' y='0'%3e%3c/use%3e%3cuse xlink:href='%23MJMATHI-64' x='1752' y='0'%3e%3c/use%3e%3c/g%3e%3cg transform='translate(60%2c-1056)'%3e%3cuse xlink:href='%23MJMAIN-31' x='0' y='0'%3e%3c/use%3e%3cuse xlink:href='%23MJMAIN-2B' x='722' y='0'%3e%3c/use%3e%3cg transform='translate(1723%2c0)'%3e%3cuse xlink:href='%23MJSZ1-28'%3e%3c/use%3e%3cg transform='translate(458%2c0)'%3e%3cg transform='translate(120%2c0)'%3e%3crect stroke='none' width='524' height='60' x='0' y='220'%3e%3c/rect%3e%3cuse transform='scale(0.707)' xlink:href='%23MJMATHI-78' x='84' y='605'%3e%3c/use%3e%3cuse transform='scale(0.707)' xlink:href='%23MJMATHI-63' x='154' y='-488'%3e%3c/use%3e%3c/g%3e%3c/g%3e%3cuse xlink:href='%23MJSZ1-29' x='1223' y='-1'%3e%3c/use%3e%3cuse transform='scale(0.707)' xlink:href='%23MJMATHI-62' x='2378' y='816'%3e%3c/use%3e%3c/g%3e%3c/g%3e%3c/g%3e%3c/g%3e%3c/g%3e%3c/g%3e%3c/g%3e%3c/g%3e%3c/svg%3e)
Five-parameter logistic standard curve
'%3e%3cg transform='translate(167%2c0)'%3e%3cg transform='translate(-13%2c0)'%3e%3cg transform='translate(0%2c477)'%3e%3cuse xlink:href='%23MJMATHI-79' x='0' y='0'%3e%3c/use%3e%3cuse xlink:href='%23MJMAIN-3D' x='775' y='0'%3e%3c/use%3e%3cuse xlink:href='%23MJMATHI-64' x='1831' y='0'%3e%3c/use%3e%3cuse xlink:href='%23MJMAIN-2B' x='2577' y='0'%3e%3c/use%3e%3cg transform='translate(3355%2c0)'%3e%3cg transform='translate(342%2c0)'%3e%3crect stroke='none' width='5313' height='60' x='0' y='220'%3e%3c/rect%3e%3cg transform='translate(1518%2c676)'%3e%3cuse xlink:href='%23MJMATHI-61' x='0' y='0'%3e%3c/use%3e%3cuse xlink:href='%23MJMAIN-2212' x='751' y='0'%3e%3c/use%3e%3cuse xlink:href='%23MJMATHI-64' x='1752' y='0'%3e%3c/use%3e%3c/g%3e%3cg transform='translate(60%2c-1177)'%3e%3cuse xlink:href='%23MJSZ2-5B'%3e%3c/use%3e%3cuse xlink:href='%23MJMAIN-31' x='472' y='0'%3e%3c/use%3e%3cuse xlink:href='%23MJMAIN-2B' x='1195' y='0'%3e%3c/use%3e%3cg transform='translate(2195%2c0)'%3e%3cuse xlink:href='%23MJSZ1-28'%3e%3c/use%3e%3cg transform='translate(458%2c0)'%3e%3cg transform='translate(120%2c0)'%3e%3crect stroke='none' width='524' height='60' x='0' y='220'%3e%3c/rect%3e%3cuse transform='scale(0.707)' xlink:href='%23MJMATHI-78' x='84' y='605'%3e%3c/use%3e%3cuse transform='scale(0.707)' xlink:href='%23MJMATHI-63' x='154' y='-488'%3e%3c/use%3e%3c/g%3e%3c/g%3e%3cuse xlink:href='%23MJSZ1-29' x='1223' y='-1'%3e%3c/use%3e%3cuse transform='scale(0.707)' xlink:href='%23MJMATHI-62' x='2378' y='816'%3e%3c/use%3e%3c/g%3e%3cuse xlink:href='%23MJSZ2-5D' x='4281' y='-1'%3e%3c/use%3e%3cuse transform='scale(0.707)' xlink:href='%23MJMATHI-67' x='6723' y='1240'%3e%3c/use%3e%3c/g%3e%3c/g%3e%3c/g%3e%3c/g%3e%3c/g%3e%3c/g%3e%3c/g%3e%3c/svg%3e)
Where: x is analyte concentration; y is optical density, peak height or T/C ratio; a is the minimum asymptote; d is the maximum asymptote; c is the inflection concentration or EC50; b is the slope parameter; and g is the asymmetry parameter. When g = 1, the 5PL model reduces to a symmetric 4PL form.
Interpretation: Differences in a can suggest phone-specific optical baseline offsets. Differences in b or c may indicate different dynamic range scaling or response steepness. Treat fitted parameters cautiously when the concentration range is sparse or when the fit is not identifiable.
Concentration-specific residual relative to a reference curve
'%3e%3cg transform='translate(167%2c0)'%3e%3cg transform='translate(-13%2c0)'%3e%3cg transform='translate(0%2c-6)'%3e%3cuse xlink:href='%23MJMAIN-52'%3e%3c/use%3e%3cuse xlink:href='%23MJMAIN-65' x='736' y='0'%3e%3c/use%3e%3cuse xlink:href='%23MJMAIN-73' x='1181' y='0'%3e%3c/use%3e%3cg transform='translate(1575%2c-150)'%3e%3cuse transform='scale(0.707)' xlink:href='%23MJMATHI-70' x='0' y='0'%3e%3c/use%3e%3cuse transform='scale(0.707)' xlink:href='%23MJMAIN-2C' x='503' y='0'%3e%3c/use%3e%3cuse transform='scale(0.707)' xlink:href='%23MJMATHI-6B' x='782' y='0'%3e%3c/use%3e%3c/g%3e%3cuse xlink:href='%23MJMAIN-3D' x='2874' y='0'%3e%3c/use%3e%3cg transform='translate(3931%2c0)'%3e%3cuse xlink:href='%23MJMATHI-79' x='0' y='0'%3e%3c/use%3e%3cg transform='translate(490%2c-150)'%3e%3cuse transform='scale(0.707)' xlink:href='%23MJMATHI-70' x='0' y='0'%3e%3c/use%3e%3cuse transform='scale(0.707)' xlink:href='%23MJMAIN-2C' x='503' y='0'%3e%3c/use%3e%3cuse transform='scale(0.707)' xlink:href='%23MJMATHI-6B' x='782' y='0'%3e%3c/use%3e%3c/g%3e%3c/g%3e%3cuse xlink:href='%23MJMAIN-2212' x='5665' y='0'%3e%3c/use%3e%3cg transform='translate(6666%2c0)'%3e%3cuse xlink:href='%23MJMATHI-79' x='1' y='0'%3e%3c/use%3e%3cuse xlink:href='%23MJMAIN-5E' x='60' y='1'%3e%3c/use%3e%3cg transform='translate(560%2c-242)'%3e%3cuse transform='scale(0.707)' xlink:href='%23MJMAIN-72'%3e%3c/use%3e%3cuse transform='scale(0.707)' xlink:href='%23MJMAIN-65' x='392' y='0'%3e%3c/use%3e%3cuse transform='scale(0.707)' xlink:href='%23MJMAIN-66' x='837' y='0'%3e%3c/use%3e%3c/g%3e%3c/g%3e%3cuse xlink:href='%23MJMAIN-28' x='8135' y='0'%3e%3c/use%3e%3cg transform='translate(8525%2c0)'%3e%3cuse xlink:href='%23MJMATHI-78' x='0' y='0'%3e%3c/use%3e%3cuse transform='scale(0.707)' xlink:href='%23MJMATHI-6B' x='809' y='-213'%3e%3c/use%3e%3c/g%3e%3cuse xlink:href='%23MJMAIN-29' x='9566' y='0'%3e%3c/use%3e%3c/g%3e%3c/g%3e%3c/g%3e%3c/g%3e%3c/svg%3e)
Where: y_p,k is the observed response for phone p at concentration x_k, and ŷ_ref(x_k) is the predicted response from the selected reference batch or reference calibration curve.
Interpretation: Positive residuals show over-reading relative to the reference curve; negative residuals show under-reading. Review residuals by concentration because a phone may be biased only near the decision threshold or at the edge of the measuring range.
Spreadsheet check: =ObservedResponse - ReferencePredictedResponse
Appendix D · Section 9 Phone Effect & Equivalence calculations
Purpose: Use these calculations to understand how the report estimates a phone-model effect and compares it with configured numerical margins. These calculations support review but do not replace study-design assessment for formal equivalence claims.
Estimated phone-model effect
'%3e%3cg transform='translate(167%2c0)'%3e%3cg transform='translate(-13%2c0)'%3e%3cg transform='translate(0%2c-110)'%3e%3cuse xlink:href='%23MJMAIN-394' x='0' y='0'%3e%3c/use%3e%3cuse xlink:href='%23MJMAIN-5E' x='166' y='274'%3e%3c/use%3e%3cuse xlink:href='%23MJMAIN-3D' x='1111' y='0'%3e%3c/use%3e%3cg transform='translate(2167%2c0)'%3e%3cuse xlink:href='%23MJMATHI-79' x='1' y='0'%3e%3c/use%3e%3cuse xlink:href='%23MJMAIN-AF' x='60' y='-12'%3e%3c/use%3e%3cg transform='translate(560%2c-242)'%3e%3cuse transform='scale(0.707)' xlink:href='%23MJMAIN-74'%3e%3c/use%3e%3cuse transform='scale(0.707)' xlink:href='%23MJMAIN-65' x='389' y='0'%3e%3c/use%3e%3cuse transform='scale(0.707)' xlink:href='%23MJMAIN-73' x='833' y='0'%3e%3c/use%3e%3cuse transform='scale(0.707)' xlink:href='%23MJMAIN-74' x='1228' y='0'%3e%3c/use%3e%3c/g%3e%3c/g%3e%3cuse xlink:href='%23MJMAIN-2212' x='4194' y='0'%3e%3c/use%3e%3cg transform='translate(5195%2c0)'%3e%3cuse xlink:href='%23MJMATHI-79' x='1' y='0'%3e%3c/use%3e%3cuse xlink:href='%23MJMAIN-AF' x='60' y='-12'%3e%3c/use%3e%3cg transform='translate(560%2c-242)'%3e%3cuse transform='scale(0.707)' xlink:href='%23MJMAIN-72'%3e%3c/use%3e%3cuse transform='scale(0.707)' xlink:href='%23MJMAIN-65' x='392' y='0'%3e%3c/use%3e%3cuse transform='scale(0.707)' xlink:href='%23MJMAIN-66' x='837' y='0'%3e%3c/use%3e%3c/g%3e%3c/g%3e%3c/g%3e%3c/g%3e%3c/g%3e%3c/g%3e%3c/svg%3e)
The same structure may be used when the comparison is against the pooled mean of the other phone models, depending on the report configuration.
Standard error of the difference
'%3e%3cg transform='translate(167%2c0)'%3e%3cg transform='translate(-13%2c0)'%3e%3cg transform='translate(0%2c-155)'%3e%3cuse xlink:href='%23MJMATHI-53' x='0' y='0'%3e%3c/use%3e%3cg transform='translate(645%2c0)'%3e%3cuse xlink:href='%23MJMATHI-45' x='0' y='0'%3e%3c/use%3e%3cg transform='translate(738%2c-367)'%3e%3cuse transform='scale(0.707)' xlink:href='%23MJMAIN-394' x='0' y='0'%3e%3c/use%3e%3cuse transform='scale(0.707)' xlink:href='%23MJMAIN-5E' x='166' y='310'%3e%3c/use%3e%3c/g%3e%3c/g%3e%3cuse xlink:href='%23MJMAIN-3D' x='2351' y='0'%3e%3c/use%3e%3cg transform='translate(3407%2c0)'%3e%3cuse xlink:href='%23MJSZ4-221A' x='0' y='124'%3e%3c/use%3e%3crect stroke='none' width='5296' height='60' x='1000' y='1815'%3e%3c/rect%3e%3cg transform='translate(1000%2c0)'%3e%3cg transform='translate(120%2c0)'%3e%3crect stroke='none' width='1964' height='60' x='0' y='220'%3e%3c/rect%3e%3cg transform='translate(125%2c765)'%3e%3cuse xlink:href='%23MJMATHI-73' x='0' y='0'%3e%3c/use%3e%3cuse transform='scale(0.707)' xlink:href='%23MJMAIN-32' x='663' y='488'%3e%3c/use%3e%3cg transform='translate(469%2c-272)'%3e%3cuse transform='scale(0.707)' xlink:href='%23MJMAIN-74'%3e%3c/use%3e%3cuse transform='scale(0.707)' xlink:href='%23MJMAIN-65' x='389' y='0'%3e%3c/use%3e%3cuse transform='scale(0.707)' xlink:href='%23MJMAIN-73' x='833' y='0'%3e%3c/use%3e%3cuse transform='scale(0.707)' xlink:href='%23MJMAIN-74' x='1228' y='0'%3e%3c/use%3e%3c/g%3e%3c/g%3e%3cg transform='translate(60%2c-686)'%3e%3cuse xlink:href='%23MJMATHI-6E' x='0' y='0'%3e%3c/use%3e%3cg transform='translate(600%2c-150)'%3e%3cuse transform='scale(0.707)' xlink:href='%23MJMAIN-74'%3e%3c/use%3e%3cuse transform='scale(0.707)' xlink:href='%23MJMAIN-65' x='389' y='0'%3e%3c/use%3e%3cuse transform='scale(0.707)' xlink:href='%23MJMAIN-73' x='833' y='0'%3e%3c/use%3e%3cuse transform='scale(0.707)' xlink:href='%23MJMAIN-74' x='1228' y='0'%3e%3c/use%3e%3c/g%3e%3c/g%3e%3c/g%3e%3cuse xlink:href='%23MJMAIN-2B' x='2426' y='0'%3e%3c/use%3e%3cg transform='translate(3205%2c0)'%3e%3cg transform='translate(342%2c0)'%3e%3crect stroke='none' width='1629' height='60' x='0' y='220'%3e%3c/rect%3e%3cg transform='translate(125%2c829)'%3e%3cuse xlink:href='%23MJMATHI-73' x='0' y='0'%3e%3c/use%3e%3cuse transform='scale(0.707)' xlink:href='%23MJMAIN-32' x='663' y='488'%3e%3c/use%3e%3cg transform='translate(469%2c-335)'%3e%3cuse transform='scale(0.707)' xlink:href='%23MJMAIN-72'%3e%3c/use%3e%3cuse transform='scale(0.707)' xlink:href='%23MJMAIN-65' x='392' y='0'%3e%3c/use%3e%3cuse transform='scale(0.707)' xlink:href='%23MJMAIN-66' x='837' y='0'%3e%3c/use%3e%3c/g%3e%3c/g%3e%3cg transform='translate(60%2c-686)'%3e%3cuse xlink:href='%23MJMATHI-6E' x='0' y='0'%3e%3c/use%3e%3cg transform='translate(600%2c-155)'%3e%3cuse transform='scale(0.707)' xlink:href='%23MJMAIN-72'%3e%3c/use%3e%3cuse transform='scale(0.707)' xlink:href='%23MJMAIN-65' x='392' y='0'%3e%3c/use%3e%3cuse transform='scale(0.707)' xlink:href='%23MJMAIN-66' x='837' y='0'%3e%3c/use%3e%3c/g%3e%3c/g%3e%3c/g%3e%3c/g%3e%3c/g%3e%3c/g%3e%3c/g%3e%3c/g%3e%3c/g%3e%3c/g%3e%3c/svg%3e)
Where: s_test and s_ref are the standard deviations for the test and reference phone groups, and n_test and n_ref are their sample counts.
Spreadsheet check: =SQRT((STDEV.S(test_range)^2/COUNT(test_range))+(STDEV.S(ref_range)^2/COUNT(ref_range)))
Confidence interval for the effect estimate
'%3e%3cg transform='translate(167%2c0)'%3e%3cg transform='translate(-13%2c0)'%3e%3cuse xlink:href='%23MJMAIN-43'%3e%3c/use%3e%3cuse xlink:href='%23MJMAIN-49' x='722' y='0'%3e%3c/use%3e%3cuse xlink:href='%23MJMAIN-3D' x='1361' y='0'%3e%3c/use%3e%3cg transform='translate(2418%2c0)'%3e%3cuse xlink:href='%23MJSZ2-5B'%3e%3c/use%3e%3cg transform='translate(472%2c0)'%3e%3cuse xlink:href='%23MJMAIN-394' x='0' y='0'%3e%3c/use%3e%3cuse xlink:href='%23MJMAIN-5E' x='166' y='274'%3e%3c/use%3e%3c/g%3e%3cuse xlink:href='%23MJMAIN-2212' x='1528' y='0'%3e%3c/use%3e%3cg transform='translate(2528%2c0)'%3e%3cuse xlink:href='%23MJMATHI-74' x='0' y='0'%3e%3c/use%3e%3cg transform='translate(361%2c-150)'%3e%3cuse transform='scale(0.707)' xlink:href='%23MJMAIN-31' x='0' y='0'%3e%3c/use%3e%3cuse transform='scale(0.707)' xlink:href='%23MJMAIN-2212' x='500' y='0'%3e%3c/use%3e%3cuse transform='scale(0.707)' xlink:href='%23MJMATHI-3B1' x='1279' y='0'%3e%3c/use%3e%3cuse transform='scale(0.707)' xlink:href='%23MJMAIN-2C' x='1919' y='0'%3e%3c/use%3e%3cuse transform='scale(0.707)' xlink:href='%23MJMATHI-3BD' x='2198' y='0'%3e%3c/use%3e%3c/g%3e%3c/g%3e%3cuse xlink:href='%23MJMAIN-22C5' x='5142' y='0'%3e%3c/use%3e%3cuse xlink:href='%23MJMATHI-53' x='5642' y='0'%3e%3c/use%3e%3cg transform='translate(6288%2c0)'%3e%3cuse xlink:href='%23MJMATHI-45' x='0' y='0'%3e%3c/use%3e%3cg transform='translate(738%2c-367)'%3e%3cuse transform='scale(0.707)' xlink:href='%23MJMAIN-394' x='0' y='0'%3e%3c/use%3e%3cuse transform='scale(0.707)' xlink:href='%23MJMAIN-5E' x='166' y='310'%3e%3c/use%3e%3c/g%3e%3c/g%3e%3cuse xlink:href='%23MJMAIN-2C' x='7716' y='0'%3e%3c/use%3e%3cg transform='translate(8439%2c0)'%3e%3cuse xlink:href='%23MJMAIN-394' x='0' y='0'%3e%3c/use%3e%3cuse xlink:href='%23MJMAIN-5E' x='166' y='274'%3e%3c/use%3e%3c/g%3e%3cuse xlink:href='%23MJMAIN-2B' x='9494' y='0'%3e%3c/use%3e%3cg transform='translate(10495%2c0)'%3e%3cuse xlink:href='%23MJMATHI-74' x='0' y='0'%3e%3c/use%3e%3cg transform='translate(361%2c-150)'%3e%3cuse transform='scale(0.707)' xlink:href='%23MJMAIN-31' x='0' y='0'%3e%3c/use%3e%3cuse transform='scale(0.707)' xlink:href='%23MJMAIN-2212' x='500' y='0'%3e%3c/use%3e%3cuse transform='scale(0.707)' xlink:href='%23MJMATHI-3B1' x='1279' y='0'%3e%3c/use%3e%3cuse transform='scale(0.707)' xlink:href='%23MJMAIN-2C' x='1919' y='0'%3e%3c/use%3e%3cuse transform='scale(0.707)' xlink:href='%23MJMATHI-3BD' x='2198' y='0'%3e%3c/use%3e%3c/g%3e%3c/g%3e%3cuse xlink:href='%23MJMAIN-22C5' x='13108' y='0'%3e%3c/use%3e%3cuse xlink:href='%23MJMATHI-53' x='13609' y='0'%3e%3c/use%3e%3cg transform='translate(14254%2c0)'%3e%3cuse xlink:href='%23MJMATHI-45' x='0' y='0'%3e%3c/use%3e%3cg transform='translate(738%2c-367)'%3e%3cuse transform='scale(0.707)' xlink:href='%23MJMAIN-394' x='0' y='0'%3e%3c/use%3e%3cuse transform='scale(0.707)' xlink:href='%23MJMAIN-5E' x='166' y='310'%3e%3c/use%3e%3c/g%3e%3c/g%3e%3cuse xlink:href='%23MJSZ2-5D' x='15682' y='-1'%3e%3c/use%3e%3c/g%3e%3c/g%3e%3c/g%3e%3c/g%3e%3c/svg%3e)
Where: t_(1-α,ν) is the Student t critical value and ν is the applicable degrees of freedom, often using a Welch/Satterthwaite approximation when variances differ.
Margin comparison decision rule
'%3e%3cg transform='translate(167%2c0)'%3e%3cg transform='translate(-13%2c0)'%3e%3cuse xlink:href='%23MJMAIN-53'%3e%3c/use%3e%3cuse xlink:href='%23MJMAIN-74' x='556' y='0'%3e%3c/use%3e%3cuse xlink:href='%23MJMAIN-61' x='946' y='0'%3e%3c/use%3e%3cuse xlink:href='%23MJMAIN-74' x='1446' y='0'%3e%3c/use%3e%3cuse xlink:href='%23MJMAIN-75' x='1836' y='0'%3e%3c/use%3e%3cuse xlink:href='%23MJMAIN-73' x='2392' y='0'%3e%3c/use%3e%3cuse xlink:href='%23MJMAIN-3D' x='3064' y='0'%3e%3c/use%3e%3cg transform='translate(4121%2c0)'%3e%3cg transform='translate(0%2c2652)'%3e%3cuse xlink:href='%23MJSZ4-23A7' x='0' y='-900'%3e%3c/use%3e%3cg transform='translate(0%2c-1518.6257476554601) scale(1%2c2.1145522432651456)'%3e%3cuse xlink:href='%23MJSZ4-23AA'%3e%3c/use%3e%3c/g%3e%3cuse xlink:href='%23MJSZ4-23A8' x='0' y='-2653'%3e%3c/use%3e%3cg transform='translate(0%2c-3921.511569986837) scale(1%2c2.1145522432651456)'%3e%3cuse xlink:href='%23MJSZ4-23AA'%3e%3c/use%3e%3c/g%3e%3cuse xlink:href='%23MJSZ4-23A9' x='0' y='-3906'%3e%3c/use%3e%3c/g%3e%3cg transform='translate(1056%2c0)'%3e%3cg transform='translate(-13%2c0)'%3e%3cg transform='translate(0%2c1852)'%3e%3cuse xlink:href='%23MJTT-77'%3e%3c/use%3e%3cuse xlink:href='%23MJTT-69' x='525' y='0'%3e%3c/use%3e%3cuse xlink:href='%23MJTT-74' x='1051' y='0'%3e%3c/use%3e%3cuse xlink:href='%23MJTT-68' x='1576' y='0'%3e%3c/use%3e%3cuse xlink:href='%23MJTT-69' x='2102' y='0'%3e%3c/use%3e%3cuse xlink:href='%23MJTT-6E' x='2627' y='0'%3e%3c/use%3e%3cuse xlink:href='%23MJTT-5C' x='3153' y='0'%3e%3c/use%3e%3cuse xlink:href='%23MJTT-5F' x='3678' y='0'%3e%3c/use%3e%3cuse xlink:href='%23MJTT-6D' x='4204' y='0'%3e%3c/use%3e%3cuse xlink:href='%23MJTT-61' x='4729' y='0'%3e%3c/use%3e%3cuse xlink:href='%23MJTT-72' x='5255' y='0'%3e%3c/use%3e%3cuse xlink:href='%23MJTT-67' x='5780' y='0'%3e%3c/use%3e%3cuse xlink:href='%23MJTT-69' x='6306' y='0'%3e%3c/use%3e%3cuse xlink:href='%23MJTT-6E' x='6831' y='0'%3e%3c/use%3e%3cuse xlink:href='%23MJMAIN-2C' x='7357' y='0'%3e%3c/use%3e%3c/g%3e%3cg transform='translate(0%2c565)'%3e%3cuse xlink:href='%23MJTT-65'%3e%3c/use%3e%3cuse xlink:href='%23MJTT-78' x='525' y='0'%3e%3c/use%3e%3cuse xlink:href='%23MJTT-63' x='1051' y='0'%3e%3c/use%3e%3cuse xlink:href='%23MJTT-65' x='1576' y='0'%3e%3c/use%3e%3cuse xlink:href='%23MJTT-65' x='2102' y='0'%3e%3c/use%3e%3cuse xlink:href='%23MJTT-64' x='2627' y='0'%3e%3c/use%3e%3cuse xlink:href='%23MJTT-73' x='3153' y='0'%3e%3c/use%3e%3cuse xlink:href='%23MJTT-5C' x='3678' y='0'%3e%3c/use%3e%3cuse xlink:href='%23MJTT-5F' x='4204' y='0'%3e%3c/use%3e%3cuse xlink:href='%23MJTT-6D' x='4729' y='0'%3e%3c/use%3e%3cuse xlink:href='%23MJTT-61' x='5255' y='0'%3e%3c/use%3e%3cuse xlink:href='%23MJTT-72' x='5780' y='0'%3e%3c/use%3e%3cuse xlink:href='%23MJTT-67' x='6306' y='0'%3e%3c/use%3e%3cuse xlink:href='%23MJTT-69' x='6831' y='0'%3e%3c/use%3e%3cuse xlink:href='%23MJTT-6E' x='7357' y='0'%3e%3c/use%3e%3cuse xlink:href='%23MJMAIN-2C' x='7882' y='0'%3e%3c/use%3e%3c/g%3e%3cg transform='translate(0%2c-723)'%3e%3cuse xlink:href='%23MJTT-6E'%3e%3c/use%3e%3cuse xlink:href='%23MJTT-6F' x='525' y='0'%3e%3c/use%3e%3cuse xlink:href='%23MJTT-74' x='1051' y='0'%3e%3c/use%3e%3cuse xlink:href='%23MJTT-5C' x='1576' y='0'%3e%3c/use%3e%3cuse xlink:href='%23MJTT-5F' x='2102' y='0'%3e%3c/use%3e%3cuse xlink:href='%23MJTT-65' x='2627' y='0'%3e%3c/use%3e%3cuse xlink:href='%23MJTT-73' x='3153' y='0'%3e%3c/use%3e%3cuse xlink:href='%23MJTT-74' x='3678' y='0'%3e%3c/use%3e%3cuse xlink:href='%23MJTT-69' x='4204' y='0'%3e%3c/use%3e%3cuse xlink:href='%23MJTT-6D' x='4729' y='0'%3e%3c/use%3e%3cuse xlink:href='%23MJTT-61' x='5255' y='0'%3e%3c/use%3e%3cuse xlink:href='%23MJTT-62' x='5780' y='0'%3e%3c/use%3e%3cuse xlink:href='%23MJTT-6C' x='6306' y='0'%3e%3c/use%3e%3cuse xlink:href='%23MJTT-65' x='6831' y='0'%3e%3c/use%3e%3cuse xlink:href='%23MJMAIN-2C' x='7357' y='0'%3e%3c/use%3e%3c/g%3e%3cg transform='translate(0%2c-1923)'%3e%3cuse xlink:href='%23MJTT-6E'%3e%3c/use%3e%3cuse xlink:href='%23MJTT-6F' x='525' y='0'%3e%3c/use%3e%3cuse xlink:href='%23MJTT-74' x='1051' y='0'%3e%3c/use%3e%3cuse xlink:href='%23MJTT-63' x='2101' y='0'%3e%3c/use%3e%3cuse xlink:href='%23MJTT-6F' x='2627' y='0'%3e%3c/use%3e%3cuse xlink:href='%23MJTT-6E' x='3152' y='0'%3e%3c/use%3e%3cuse xlink:href='%23MJTT-66' x='3678' y='0'%3e%3c/use%3e%3cuse xlink:href='%23MJTT-69' x='4203' y='0'%3e%3c/use%3e%3cuse xlink:href='%23MJTT-67' x='4729' y='0'%3e%3c/use%3e%3cuse xlink:href='%23MJTT-75' x='5254' y='0'%3e%3c/use%3e%3cuse xlink:href='%23MJTT-72' x='5780' y='0'%3e%3c/use%3e%3cuse xlink:href='%23MJTT-65' x='6305' y='0'%3e%3c/use%3e%3cuse xlink:href='%23MJTT-64' x='6831' y='0'%3e%3c/use%3e%3cuse xlink:href='%23MJMAIN-2C' x='7356' y='0'%3e%3c/use%3e%3c/g%3e%3c/g%3e%3cg transform='translate(9148%2c0)'%3e%3cg transform='translate(0%2c1852)'%3e%3cuse xlink:href='%23MJMAIN-43'%3e%3c/use%3e%3cuse xlink:href='%23MJMAIN-49' x='722' y='0'%3e%3c/use%3e%3cg transform='translate(1084%2c-150)'%3e%3cuse transform='scale(0.707)' xlink:href='%23MJMAIN-6C'%3e%3c/use%3e%3cuse transform='scale(0.707)' xlink:href='%23MJMAIN-6F' x='278' y='0'%3e%3c/use%3e%3cuse transform='scale(0.707)' xlink:href='%23MJMAIN-77' x='779' y='0'%3e%3c/use%3e%3cuse transform='scale(0.707)' xlink:href='%23MJMAIN-65' x='1501' y='0'%3e%3c/use%3e%3cuse transform='scale(0.707)' xlink:href='%23MJMAIN-72' x='1946' y='0'%3e%3c/use%3e%3c/g%3e%3cuse xlink:href='%23MJMAIN-2265' x='3115' y='0'%3e%3c/use%3e%3cuse xlink:href='%23MJMAIN-2212' x='4171' y='0'%3e%3c/use%3e%3cg transform='translate(4950%2c0)'%3e%3cuse xlink:href='%23MJMATHI-3B8' x='0' y='0'%3e%3c/use%3e%3cuse transform='scale(0.707)' xlink:href='%23MJMATHI-4C' x='663' y='-213'%3e%3c/use%3e%3c/g%3e%3cg transform='translate(6001%2c0)'%3e%3cuse xlink:href='%23MJMAIN-61' x='250' y='0'%3e%3c/use%3e%3cuse xlink:href='%23MJMAIN-6E' x='750' y='0'%3e%3c/use%3e%3cuse xlink:href='%23MJMAIN-64' x='1307' y='0'%3e%3c/use%3e%3c/g%3e%3cg transform='translate(8115%2c0)'%3e%3cuse xlink:href='%23MJMAIN-43'%3e%3c/use%3e%3cuse xlink:href='%23MJMAIN-49' x='722' y='0'%3e%3c/use%3e%3cg transform='translate(1084%2c-150)'%3e%3cuse transform='scale(0.707)' xlink:href='%23MJMAIN-75'%3e%3c/use%3e%3cuse transform='scale(0.707)' xlink:href='%23MJMAIN-70' x='556' y='0'%3e%3c/use%3e%3cuse transform='scale(0.707)' xlink:href='%23MJMAIN-70' x='1113' y='0'%3e%3c/use%3e%3cuse transform='scale(0.707)' xlink:href='%23MJMAIN-65' x='1669' y='0'%3e%3c/use%3e%3cuse transform='scale(0.707)' xlink:href='%23MJMAIN-72' x='2114' y='0'%3e%3c/use%3e%3c/g%3e%3c/g%3e%3cuse xlink:href='%23MJMAIN-2264' x='11349' y='0'%3e%3c/use%3e%3cuse xlink:href='%23MJMAIN-2B' x='12405' y='0'%3e%3c/use%3e%3cg transform='translate(13183%2c0)'%3e%3cuse xlink:href='%23MJMATHI-3B8' x='0' y='0'%3e%3c/use%3e%3cuse transform='scale(0.707)' xlink:href='%23MJMATHI-55' x='663' y='-213'%3e%3c/use%3e%3c/g%3e%3c/g%3e%3cg transform='translate(0%2c565)'%3e%3cuse xlink:href='%23MJMAIN-43'%3e%3c/use%3e%3cuse xlink:href='%23MJMAIN-49' x='722' y='0'%3e%3c/use%3e%3cg transform='translate(1084%2c-150)'%3e%3cuse transform='scale(0.707)' xlink:href='%23MJMAIN-6C'%3e%3c/use%3e%3cuse transform='scale(0.707)' xlink:href='%23MJMAIN-6F' x='278' y='0'%3e%3c/use%3e%3cuse transform='scale(0.707)' xlink:href='%23MJMAIN-77' x='779' y='0'%3e%3c/use%3e%3cuse transform='scale(0.707)' xlink:href='%23MJMAIN-65' x='1501' y='0'%3e%3c/use%3e%3cuse transform='scale(0.707)' xlink:href='%23MJMAIN-72' x='1946' y='0'%3e%3c/use%3e%3c/g%3e%3cuse xlink:href='%23MJMAIN-3C' x='3115' y='0'%3e%3c/use%3e%3cuse xlink:href='%23MJMAIN-2212' x='4171' y='0'%3e%3c/use%3e%3cg transform='translate(4950%2c0)'%3e%3cuse xlink:href='%23MJMATHI-3B8' x='0' y='0'%3e%3c/use%3e%3cuse transform='scale(0.707)' xlink:href='%23MJMATHI-4C' x='663' y='-213'%3e%3c/use%3e%3c/g%3e%3cg transform='translate(6001%2c0)'%3e%3cuse xlink:href='%23MJMAIN-6F' x='250' y='0'%3e%3c/use%3e%3cuse xlink:href='%23MJMAIN-72' x='750' y='0'%3e%3c/use%3e%3c/g%3e%3cg transform='translate(7394%2c0)'%3e%3cuse xlink:href='%23MJMAIN-43'%3e%3c/use%3e%3cuse xlink:href='%23MJMAIN-49' x='722' y='0'%3e%3c/use%3e%3cg transform='translate(1084%2c-150)'%3e%3cuse transform='scale(0.707)' xlink:href='%23MJMAIN-75'%3e%3c/use%3e%3cuse transform='scale(0.707)' xlink:href='%23MJMAIN-70' x='556' y='0'%3e%3c/use%3e%3cuse transform='scale(0.707)' xlink:href='%23MJMAIN-70' x='1113' y='0'%3e%3c/use%3e%3cuse transform='scale(0.707)' xlink:href='%23MJMAIN-65' x='1669' y='0'%3e%3c/use%3e%3cuse transform='scale(0.707)' xlink:href='%23MJMAIN-72' x='2114' y='0'%3e%3c/use%3e%3c/g%3e%3c/g%3e%3cuse xlink:href='%23MJMAIN-3E' x='10628' y='0'%3e%3c/use%3e%3cuse xlink:href='%23MJMAIN-2B' x='11684' y='0'%3e%3c/use%3e%3cg transform='translate(12463%2c0)'%3e%3cuse xlink:href='%23MJMATHI-3B8' x='0' y='0'%3e%3c/use%3e%3cuse transform='scale(0.707)' xlink:href='%23MJMATHI-55' x='663' y='-213'%3e%3c/use%3e%3c/g%3e%3c/g%3e%3cg transform='translate(0%2c-723)'%3e%3cuse xlink:href='%23MJMAIN-73'%3e%3c/use%3e%3cuse xlink:href='%23MJMAIN-61' x='394' y='0'%3e%3c/use%3e%3cuse xlink:href='%23MJMAIN-6D' x='895' y='0'%3e%3c/use%3e%3cuse xlink:href='%23MJMAIN-70' x='1728' y='0'%3e%3c/use%3e%3cuse xlink:href='%23MJMAIN-6C' x='2285' y='0'%3e%3c/use%3e%3cuse xlink:href='%23MJMAIN-65' x='2563' y='0'%3e%3c/use%3e%3cuse xlink:href='%23MJMAIN-63' x='3258' y='0'%3e%3c/use%3e%3cuse xlink:href='%23MJMAIN-6F' x='3702' y='0'%3e%3c/use%3e%3cuse xlink:href='%23MJMAIN-75' x='4203' y='0'%3e%3c/use%3e%3cuse xlink:href='%23MJMAIN-6E' x='4759' y='0'%3e%3c/use%3e%3cuse xlink:href='%23MJMAIN-74' x='5316' y='0'%3e%3c/use%3e%3cuse xlink:href='%23MJMAIN-2C' x='5705' y='0'%3e%3c/use%3e%3cuse xlink:href='%23MJMAIN-76' x='6234' y='0'%3e%3c/use%3e%3cuse xlink:href='%23MJMAIN-61' x='6762' y='0'%3e%3c/use%3e%3cuse xlink:href='%23MJMAIN-72' x='7263' y='0'%3e%3c/use%3e%3cuse xlink:href='%23MJMAIN-69' x='7655' y='0'%3e%3c/use%3e%3cuse xlink:href='%23MJMAIN-61' x='7934' y='0'%3e%3c/use%3e%3cuse xlink:href='%23MJMAIN-6E' x='8434' y='0'%3e%3c/use%3e%3cuse xlink:href='%23MJMAIN-63' x='8991' y='0'%3e%3c/use%3e%3cuse xlink:href='%23MJMAIN-65' x='9435' y='0'%3e%3c/use%3e%3cuse xlink:href='%23MJMAIN-6F' x='10130' y='0'%3e%3c/use%3e%3cuse xlink:href='%23MJMAIN-72' x='10630' y='0'%3e%3c/use%3e%3cuse xlink:href='%23MJMAIN-6D' x='11273' y='0'%3e%3c/use%3e%3cuse xlink:href='%23MJMAIN-6F' x='12106' y='0'%3e%3c/use%3e%3cuse xlink:href='%23MJMAIN-64' x='12607' y='0'%3e%3c/use%3e%3cuse xlink:href='%23MJMAIN-65' x='13163' y='0'%3e%3c/use%3e%3cuse xlink:href='%23MJMAIN-6C' x='13608' y='0'%3e%3c/use%3e%3cuse xlink:href='%23MJMAIN-72' x='14136' y='0'%3e%3c/use%3e%3cuse xlink:href='%23MJMAIN-65' x='14529' y='0'%3e%3c/use%3e%3cuse xlink:href='%23MJMAIN-71' x='14973' y='0'%3e%3c/use%3e%3cuse xlink:href='%23MJMAIN-75' x='15502' y='0'%3e%3c/use%3e%3cuse xlink:href='%23MJMAIN-69' x='16058' y='0'%3e%3c/use%3e%3cuse xlink:href='%23MJMAIN-72' x='16337' y='0'%3e%3c/use%3e%3cuse xlink:href='%23MJMAIN-65' x='16729' y='0'%3e%3c/use%3e%3cuse xlink:href='%23MJMAIN-6D' x='17174' y='0'%3e%3c/use%3e%3cuse xlink:href='%23MJMAIN-65' x='18007' y='0'%3e%3c/use%3e%3cuse xlink:href='%23MJMAIN-6E' x='18452' y='0'%3e%3c/use%3e%3cuse xlink:href='%23MJMAIN-74' x='19008' y='0'%3e%3c/use%3e%3cuse xlink:href='%23MJMAIN-73' x='19398' y='0'%3e%3c/use%3e%3cuse xlink:href='%23MJMAIN-69' x='20042' y='0'%3e%3c/use%3e%3cuse xlink:href='%23MJMAIN-6E' x='20321' y='0'%3e%3c/use%3e%3cuse xlink:href='%23MJMAIN-73' x='20877' y='0'%3e%3c/use%3e%3cuse xlink:href='%23MJMAIN-75' x='21272' y='0'%3e%3c/use%3e%3cuse xlink:href='%23MJMAIN-66' x='21828' y='0'%3e%3c/use%3e%3cuse xlink:href='%23MJMAIN-66' x='22135' y='0'%3e%3c/use%3e%3cuse xlink:href='%23MJMAIN-69' x='22441' y='0'%3e%3c/use%3e%3cuse xlink:href='%23MJMAIN-63' x='22720' y='0'%3e%3c/use%3e%3cuse xlink:href='%23MJMAIN-69' x='23164' y='0'%3e%3c/use%3e%3cuse xlink:href='%23MJMAIN-65' x='23443' y='0'%3e%3c/use%3e%3cuse xlink:href='%23MJMAIN-6E' x='23887' y='0'%3e%3c/use%3e%3cuse xlink:href='%23MJMAIN-74' x='24444' y='0'%3e%3c/use%3e%3c/g%3e%3cg transform='translate(0%2c-1923)'%3e%3cuse xlink:href='%23MJMAIN-6E'%3e%3c/use%3e%3cuse xlink:href='%23MJMAIN-6F' x='556' y='0'%3e%3c/use%3e%3cuse xlink:href='%23MJMAIN-6D' x='1307' y='0'%3e%3c/use%3e%3cuse xlink:href='%23MJMAIN-61' x='2140' y='0'%3e%3c/use%3e%3cuse xlink:href='%23MJMAIN-72' x='2641' y='0'%3e%3c/use%3e%3cuse xlink:href='%23MJMAIN-67' x='3033' y='0'%3e%3c/use%3e%3cuse xlink:href='%23MJMAIN-69' x='3534' y='0'%3e%3c/use%3e%3cuse xlink:href='%23MJMAIN-6E' x='3812' y='0'%3e%3c/use%3e%3cuse xlink:href='%23MJMAIN-73' x='4619' y='0'%3e%3c/use%3e%3cuse xlink:href='%23MJMAIN-61' x='5013' y='0'%3e%3c/use%3e%3cuse xlink:href='%23MJMAIN-76' x='5514' y='0'%3e%3c/use%3e%3cuse xlink:href='%23MJMAIN-65' x='6042' y='0'%3e%3c/use%3e%3cuse xlink:href='%23MJMAIN-64' x='6487' y='0'%3e%3c/use%3e%3cuse xlink:href='%23MJMAIN-62' x='7293' y='0'%3e%3c/use%3e%3cuse xlink:href='%23MJMAIN-65' x='7850' y='0'%3e%3c/use%3e%3cuse xlink:href='%23MJMAIN-66' x='8294' y='0'%3e%3c/use%3e%3cuse xlink:href='%23MJMAIN-6F' x='8601' y='0'%3e%3c/use%3e%3cuse xlink:href='%23MJMAIN-72' x='9101' y='0'%3e%3c/use%3e%3cuse xlink:href='%23MJMAIN-65' x='9494' y='0'%3e%3c/use%3e%3cuse xlink:href='%23MJMAIN-72' x='10188' y='0'%3e%3c/use%3e%3cuse xlink:href='%23MJMAIN-65' x='10581' y='0'%3e%3c/use%3e%3cuse xlink:href='%23MJMAIN-70' x='11025' y='0'%3e%3c/use%3e%3cuse xlink:href='%23MJMAIN-6F' x='11582' y='0'%3e%3c/use%3e%3cuse xlink:href='%23MJMAIN-72' x='12082' y='0'%3e%3c/use%3e%3cuse xlink:href='%23MJMAIN-74' x='12475' y='0'%3e%3c/use%3e%3cuse xlink:href='%23MJMAIN-67' x='13114' y='0'%3e%3c/use%3e%3cuse xlink:href='%23MJMAIN-65' x='13615' y='0'%3e%3c/use%3e%3cuse xlink:href='%23MJMAIN-6E' x='14059' y='0'%3e%3c/use%3e%3cuse xlink:href='%23MJMAIN-65' x='14616' y='0'%3e%3c/use%3e%3cuse xlink:href='%23MJMAIN-72' x='15060' y='0'%3e%3c/use%3e%3cuse xlink:href='%23MJMAIN-61' x='15453' y='0'%3e%3c/use%3e%3cuse xlink:href='%23MJMAIN-74' x='15953' y='0'%3e%3c/use%3e%3cuse xlink:href='%23MJMAIN-69' x='16343' y='0'%3e%3c/use%3e%3cuse xlink:href='%23MJMAIN-6F' x='16621' y='0'%3e%3c/use%3e%3cuse xlink:href='%23MJMAIN-6E' x='17122' y='0'%3e%3c/use%3e%3c/g%3e%3c/g%3e%3c/g%3e%3c/g%3e%3c/g%3e%3c/g%3e%3c/g%3e%3c/svg%3e)
Where: -θ_L and +θ_U are the configured lower and upper acceptance margins.
Interpretation: A point estimate inside the margin is not enough. For an interval-based margin comparison, the full confidence interval must fit inside the configured bounds. Sparse counts, non-crossed designs and unbalanced phone × batch × concentration coverage should be flagged before using the result as evidence.
Appendix E · Section 10 Environmental Factors and Capture Robustness calculations
Purpose: Use these calculations to explore whether capture telemetry such as lux, pitch or yaw is associated with signal or precision. These outputs are exploratory unless the study was designed to test environmental robustness.
Pearson correlation coefficient
'%3e%3cg transform='translate(167%2c0)'%3e%3cg transform='translate(-13%2c0)'%3e%3cg transform='translate(0%2c375)'%3e%3cuse xlink:href='%23MJMATHI-72' x='0' y='0'%3e%3c/use%3e%3cuse xlink:href='%23MJMAIN-3D' x='729' y='0'%3e%3c/use%3e%3cg transform='translate(1507%2c0)'%3e%3cg transform='translate(397%2c0)'%3e%3crect stroke='none' width='14218' height='60' x='0' y='220'%3e%3c/rect%3e%3cg transform='translate(2333%2c780)'%3e%3cuse xlink:href='%23MJSZ1-2211' x='0' y='0'%3e%3c/use%3e%3cuse transform='scale(0.707)' xlink:href='%23MJMATHI-6E' x='1494' y='675'%3e%3c/use%3e%3cg transform='translate(1056%2c-287)'%3e%3cuse transform='scale(0.707)' xlink:href='%23MJMATHI-69' x='0' y='0'%3e%3c/use%3e%3cuse transform='scale(0.707)' xlink:href='%23MJMAIN-3D' x='345' y='0'%3e%3c/use%3e%3cuse transform='scale(0.707)' xlink:href='%23MJMAIN-31' x='1124' y='0'%3e%3c/use%3e%3c/g%3e%3cuse xlink:href='%23MJMAIN-28' x='2305' y='0'%3e%3c/use%3e%3cg transform='translate(2694%2c0)'%3e%3cuse xlink:href='%23MJMATHI-45' x='0' y='0'%3e%3c/use%3e%3cuse transform='scale(0.707)' xlink:href='%23MJMATHI-69' x='1044' y='-213'%3e%3c/use%3e%3c/g%3e%3cuse xlink:href='%23MJMAIN-2212' x='3999' y='0'%3e%3c/use%3e%3cg transform='translate(5000%2c0)'%3e%3cuse xlink:href='%23MJMATHI-45' x='0' y='0'%3e%3c/use%3e%3cuse xlink:href='%23MJMAIN-AF' x='232' y='225'%3e%3c/use%3e%3c/g%3e%3cuse xlink:href='%23MJMAIN-29' x='5764' y='0'%3e%3c/use%3e%3cuse xlink:href='%23MJMAIN-28' x='6154' y='0'%3e%3c/use%3e%3cg transform='translate(6543%2c0)'%3e%3cuse xlink:href='%23MJMATHI-79' x='0' y='0'%3e%3c/use%3e%3cuse transform='scale(0.707)' xlink:href='%23MJMATHI-69' x='693' y='-213'%3e%3c/use%3e%3c/g%3e%3cuse xlink:href='%23MJMAIN-2212' x='7600' y='0'%3e%3c/use%3e%3cg transform='translate(8601%2c0)'%3e%3cuse xlink:href='%23MJMATHI-79' x='1' y='0'%3e%3c/use%3e%3cuse xlink:href='%23MJMAIN-AF' x='60' y='-12'%3e%3c/use%3e%3c/g%3e%3cuse xlink:href='%23MJMAIN-29' x='9162' y='0'%3e%3c/use%3e%3c/g%3e%3cg transform='translate(60%2c-1225)'%3e%3cuse xlink:href='%23MJSZ2-221A' x='0' y='27'%3e%3c/use%3e%3crect stroke='none' width='13098' height='60' x='1000' y='1118'%3e%3c/rect%3e%3cg transform='translate(1000%2c0)'%3e%3cuse xlink:href='%23MJSZ1-2211' x='0' y='0'%3e%3c/use%3e%3cuse transform='scale(0.707)' xlink:href='%23MJMATHI-6E' x='1494' y='675'%3e%3c/use%3e%3cg transform='translate(1056%2c-287)'%3e%3cuse transform='scale(0.707)' xlink:href='%23MJMATHI-69' x='0' y='0'%3e%3c/use%3e%3cuse transform='scale(0.707)' xlink:href='%23MJMAIN-3D' x='345' y='0'%3e%3c/use%3e%3cuse transform='scale(0.707)' xlink:href='%23MJMAIN-31' x='1124' y='0'%3e%3c/use%3e%3c/g%3e%3cuse xlink:href='%23MJMAIN-28' x='2305' y='0'%3e%3c/use%3e%3cg transform='translate(2694%2c0)'%3e%3cuse xlink:href='%23MJMATHI-45' x='0' y='0'%3e%3c/use%3e%3cuse transform='scale(0.707)' xlink:href='%23MJMATHI-69' x='1044' y='-213'%3e%3c/use%3e%3c/g%3e%3cuse xlink:href='%23MJMAIN-2212' x='3999' y='0'%3e%3c/use%3e%3cg transform='translate(5000%2c0)'%3e%3cuse xlink:href='%23MJMATHI-45' x='0' y='0'%3e%3c/use%3e%3cuse xlink:href='%23MJMAIN-AF' x='232' y='225'%3e%3c/use%3e%3c/g%3e%3cg transform='translate(5764%2c0)'%3e%3cuse xlink:href='%23MJMAIN-29' x='0' y='0'%3e%3c/use%3e%3cuse transform='scale(0.707)' xlink:href='%23MJMAIN-32' x='550' y='408'%3e%3c/use%3e%3c/g%3e%3cg transform='translate(6941%2c0)'%3e%3cuse xlink:href='%23MJSZ1-2211' x='0' y='0'%3e%3c/use%3e%3cuse transform='scale(0.707)' xlink:href='%23MJMATHI-6E' x='1494' y='675'%3e%3c/use%3e%3cg transform='translate(1056%2c-287)'%3e%3cuse transform='scale(0.707)' xlink:href='%23MJMATHI-69' x='0' y='0'%3e%3c/use%3e%3cuse transform='scale(0.707)' xlink:href='%23MJMAIN-3D' x='345' y='0'%3e%3c/use%3e%3cuse transform='scale(0.707)' xlink:href='%23MJMAIN-31' x='1124' y='0'%3e%3c/use%3e%3c/g%3e%3c/g%3e%3cuse xlink:href='%23MJMAIN-28' x='9246' y='0'%3e%3c/use%3e%3cg transform='translate(9636%2c0)'%3e%3cuse xlink:href='%23MJMATHI-79' x='0' y='0'%3e%3c/use%3e%3cuse transform='scale(0.707)' xlink:href='%23MJMATHI-69' x='693' y='-213'%3e%3c/use%3e%3c/g%3e%3cuse xlink:href='%23MJMAIN-2212' x='10693' y='0'%3e%3c/use%3e%3cg transform='translate(11694%2c0)'%3e%3cuse xlink:href='%23MJMATHI-79' x='1' y='0'%3e%3c/use%3e%3cuse xlink:href='%23MJMAIN-AF' x='60' y='-12'%3e%3c/use%3e%3c/g%3e%3cg transform='translate(12254%2c0)'%3e%3cuse xlink:href='%23MJMAIN-29' x='0' y='0'%3e%3c/use%3e%3cuse transform='scale(0.707)' xlink:href='%23MJMAIN-32' x='550' y='408'%3e%3c/use%3e%3c/g%3e%3c/g%3e%3c/g%3e%3c/g%3e%3c/g%3e%3c/g%3e%3c/g%3e%3c/g%3e%3c/g%3e%3c/svg%3e)
Where: E_i is an environmental parameter, such as lux, pitch or yaw, and y_i is the signal or T/C ratio.
Interpretation: Pearson correlation measures linear association. A visible trend may be caused by confounding if one phone, batch or concentration dominates a particular environmental range.
Spreadsheet check: =CORREL(environment_range, signal_range)
Spearman rank correlation
'%3e%3cg transform='translate(167%2c0)'%3e%3cg transform='translate(-13%2c0)'%3e%3cg transform='translate(0%2c-59)'%3e%3cuse xlink:href='%23MJMATHI-72' x='0' y='0'%3e%3c/use%3e%3cuse transform='scale(0.707)' xlink:href='%23MJMATHI-73' x='638' y='-213'%3e%3c/use%3e%3cuse xlink:href='%23MJMAIN-3D' x='1161' y='0'%3e%3c/use%3e%3cuse xlink:href='%23MJMAIN-31' x='2217' y='0'%3e%3c/use%3e%3cuse xlink:href='%23MJMAIN-2212' x='2940' y='0'%3e%3c/use%3e%3cg transform='translate(3718%2c0)'%3e%3cg transform='translate(342%2c0)'%3e%3crect stroke='none' width='4277' height='60' x='0' y='220'%3e%3c/rect%3e%3cg transform='translate(79%2c798)'%3e%3cuse xlink:href='%23MJMAIN-36' x='0' y='0'%3e%3c/use%3e%3cg transform='translate(667%2c0)'%3e%3cuse xlink:href='%23MJSZ1-2211' x='0' y='0'%3e%3c/use%3e%3cuse transform='scale(0.707)' xlink:href='%23MJMATHI-6E' x='1494' y='675'%3e%3c/use%3e%3cg transform='translate(1056%2c-287)'%3e%3cuse transform='scale(0.707)' xlink:href='%23MJMATHI-69' x='0' y='0'%3e%3c/use%3e%3cuse transform='scale(0.707)' xlink:href='%23MJMAIN-3D' x='345' y='0'%3e%3c/use%3e%3cuse transform='scale(0.707)' xlink:href='%23MJMAIN-31' x='1124' y='0'%3e%3c/use%3e%3c/g%3e%3c/g%3e%3cg transform='translate(3139%2c0)'%3e%3cuse xlink:href='%23MJMATHI-64' x='0' y='0'%3e%3c/use%3e%3cuse transform='scale(0.707)' xlink:href='%23MJMAIN-32' x='741' y='488'%3e%3c/use%3e%3cuse transform='scale(0.707)' xlink:href='%23MJMATHI-69' x='736' y='-430'%3e%3c/use%3e%3c/g%3e%3c/g%3e%3cg transform='translate(60%2c-747)'%3e%3cuse xlink:href='%23MJMATHI-6E' x='0' y='0'%3e%3c/use%3e%3cuse xlink:href='%23MJMAIN-28' x='600' y='0'%3e%3c/use%3e%3cg transform='translate(990%2c0)'%3e%3cuse xlink:href='%23MJMATHI-6E' x='0' y='0'%3e%3c/use%3e%3cuse transform='scale(0.707)' xlink:href='%23MJMAIN-32' x='849' y='408'%3e%3c/use%3e%3c/g%3e%3cuse xlink:href='%23MJMAIN-2212' x='2266' y='0'%3e%3c/use%3e%3cuse xlink:href='%23MJMAIN-31' x='3267' y='0'%3e%3c/use%3e%3cuse xlink:href='%23MJMAIN-29' x='3767' y='0'%3e%3c/use%3e%3c/g%3e%3c/g%3e%3c/g%3e%3c/g%3e%3c/g%3e%3c/g%3e%3c/g%3e%3c/svg%3e)
Where: d_i is the difference between the rank of the environmental value and the rank of the signal value for observation i.
Interpretation: Spearman correlation detects monotonic relationships that are not necessarily linear. It is useful when signal changes steadily with lux or angle but not at a constant rate.
Lux-banded precision
'%3e%3cg transform='translate(167%2c0)'%3e%3cg transform='translate(-13%2c0)'%3e%3cuse xlink:href='%23MJMAIN-25' x='0' y='0'%3e%3c/use%3e%3cg transform='translate(833%2c0)'%3e%3cuse xlink:href='%23MJMAIN-43'%3e%3c/use%3e%3cuse xlink:href='%23MJMAIN-56' x='722' y='0'%3e%3c/use%3e%3cg transform='translate(1473%2c-150)'%3e%3cuse transform='scale(0.707)' xlink:href='%23MJMAIN-74'%3e%3c/use%3e%3cuse transform='scale(0.707)' xlink:href='%23MJMAIN-69' x='389' y='0'%3e%3c/use%3e%3cuse transform='scale(0.707)' xlink:href='%23MJMAIN-65' x='668' y='0'%3e%3c/use%3e%3cuse transform='scale(0.707)' xlink:href='%23MJMAIN-72' x='1112' y='0'%3e%3c/use%3e%3c/g%3e%3c/g%3e%3cuse xlink:href='%23MJMAIN-3D' x='3748' y='0'%3e%3c/use%3e%3cg transform='translate(4804%2c0)'%3e%3cuse xlink:href='%23MJSZ3-28'%3e%3c/use%3e%3cg transform='translate(736%2c0)'%3e%3cg transform='translate(120%2c0)'%3e%3crect stroke='none' width='1844' height='60' x='0' y='220'%3e%3c/rect%3e%3cg transform='translate(105%2c676)'%3e%3cuse xlink:href='%23MJMATHI-73' x='0' y='0'%3e%3c/use%3e%3cg transform='translate(469%2c-150)'%3e%3cuse transform='scale(0.707)' xlink:href='%23MJMAIN-74'%3e%3c/use%3e%3cuse transform='scale(0.707)' xlink:href='%23MJMAIN-69' x='389' y='0'%3e%3c/use%3e%3cuse transform='scale(0.707)' xlink:href='%23MJMAIN-65' x='668' y='0'%3e%3c/use%3e%3cuse transform='scale(0.707)' xlink:href='%23MJMAIN-72' x='1112' y='0'%3e%3c/use%3e%3c/g%3e%3c/g%3e%3cg transform='translate(60%2c-686)'%3e%3cuse xlink:href='%23MJMATHI-79' x='1' y='0'%3e%3c/use%3e%3cuse xlink:href='%23MJMAIN-AF' x='60' y='-12'%3e%3c/use%3e%3cg transform='translate(560%2c-242)'%3e%3cuse transform='scale(0.707)' xlink:href='%23MJMAIN-74'%3e%3c/use%3e%3cuse transform='scale(0.707)' xlink:href='%23MJMAIN-69' x='389' y='0'%3e%3c/use%3e%3cuse transform='scale(0.707)' xlink:href='%23MJMAIN-65' x='668' y='0'%3e%3c/use%3e%3cuse transform='scale(0.707)' xlink:href='%23MJMAIN-72' x='1112' y='0'%3e%3c/use%3e%3c/g%3e%3c/g%3e%3c/g%3e%3c/g%3e%3cuse xlink:href='%23MJSZ3-29' x='2821' y='-1'%3e%3c/use%3e%3c/g%3e%3cuse xlink:href='%23MJMAIN-D7' x='8584' y='0'%3e%3c/use%3e%3cg transform='translate(9585%2c0)'%3e%3cuse xlink:href='%23MJMAIN-31'%3e%3c/use%3e%3cuse xlink:href='%23MJMAIN-30' x='500' y='0'%3e%3c/use%3e%3cuse xlink:href='%23MJMAIN-30' x='1001' y='0'%3e%3c/use%3e%3c/g%3e%3c/g%3e%3c/g%3e%3c/g%3e%3c/svg%3e)
Where: observations are grouped into lux brackets, for example low, medium and high lux, and s_tier is the standard deviation within a tier at a fixed concentration or other controlled stratum.
Interpretation: Compare lux-banded CV only within comparable concentration, batch and phone strata. A high CV in one lux tier may reflect different sample composition rather than an environmental effect.
Spreadsheet check: =(STDEV.S(tier_signal_range)/AVERAGE(tier_signal_range))*100
Appendix F · Section 11 Temporal Capture Dynamics and Usability calculations
Purpose: Use these calculations to describe capture timing, orientation stability and frame-fit behaviour from PMF story or frame telemetry. These are capture-dynamics metrics, not a complete measure of abandoned attempts or independent user behaviour unless those data are explicitly recorded.
Total capture duration or lock time
'%3e%3cg transform='translate(167%2c0)'%3e%3cg transform='translate(-13%2c0)'%3e%3cg transform='translate(0%2c-7)'%3e%3cuse xlink:href='%23MJMAIN-394' x='0' y='0'%3e%3c/use%3e%3cg transform='translate(833%2c0)'%3e%3cuse xlink:href='%23MJMATHI-74' x='0' y='0'%3e%3c/use%3e%3cg transform='translate(361%2c-150)'%3e%3cuse transform='scale(0.707)' xlink:href='%23MJMAIN-63'%3e%3c/use%3e%3cuse transform='scale(0.707)' xlink:href='%23MJMAIN-61' x='444' y='0'%3e%3c/use%3e%3cuse transform='scale(0.707)' xlink:href='%23MJMAIN-70' x='945' y='0'%3e%3c/use%3e%3cuse transform='scale(0.707)' xlink:href='%23MJMAIN-74' x='1501' y='0'%3e%3c/use%3e%3cuse transform='scale(0.707)' xlink:href='%23MJMAIN-75' x='1891' y='0'%3e%3c/use%3e%3cuse transform='scale(0.707)' xlink:href='%23MJMAIN-72' x='2447' y='0'%3e%3c/use%3e%3cuse transform='scale(0.707)' xlink:href='%23MJMAIN-65' x='2840' y='0'%3e%3c/use%3e%3c/g%3e%3c/g%3e%3cuse xlink:href='%23MJMAIN-3D' x='3895' y='0'%3e%3c/use%3e%3cg transform='translate(4951%2c0)'%3e%3cuse xlink:href='%23MJMATHI-74' x='0' y='0'%3e%3c/use%3e%3cg transform='translate(361%2c-155)'%3e%3cuse transform='scale(0.707)' xlink:href='%23MJMAIN-66'%3e%3c/use%3e%3cuse transform='scale(0.707)' xlink:href='%23MJMAIN-69' x='306' y='0'%3e%3c/use%3e%3cuse transform='scale(0.707)' xlink:href='%23MJMAIN-6E' x='585' y='0'%3e%3c/use%3e%3cuse transform='scale(0.707)' xlink:href='%23MJMAIN-61' x='1141' y='0'%3e%3c/use%3e%3cuse transform='scale(0.707)' xlink:href='%23MJMAIN-6C' x='1642' y='0'%3e%3c/use%3e%3cuse transform='scale(0.707)' xlink:href='%23MJMAIN-6C' x='2274' y='0'%3e%3c/use%3e%3cuse transform='scale(0.707)' xlink:href='%23MJMAIN-6F' x='2552' y='0'%3e%3c/use%3e%3cuse transform='scale(0.707)' xlink:href='%23MJMAIN-63' x='3053' y='0'%3e%3c/use%3e%3cuse transform='scale(0.707)' xlink:href='%23MJMAIN-6B' x='3497' y='0'%3e%3c/use%3e%3c/g%3e%3c/g%3e%3cuse xlink:href='%23MJMAIN-2212' x='8482' y='0'%3e%3c/use%3e%3cg transform='translate(9482%2c0)'%3e%3cuse xlink:href='%23MJMATHI-74' x='0' y='0'%3e%3c/use%3e%3cg transform='translate(361%2c-155)'%3e%3cuse transform='scale(0.707)' xlink:href='%23MJMAIN-66'%3e%3c/use%3e%3cuse transform='scale(0.707)' xlink:href='%23MJMAIN-69' x='306' y='0'%3e%3c/use%3e%3cuse transform='scale(0.707)' xlink:href='%23MJMAIN-72' x='585' y='0'%3e%3c/use%3e%3cuse transform='scale(0.707)' xlink:href='%23MJMAIN-73' x='977' y='0'%3e%3c/use%3e%3cuse transform='scale(0.707)' xlink:href='%23MJMAIN-74' x='1372' y='0'%3e%3c/use%3e%3cuse transform='scale(0.707)' xlink:href='%23MJMAIN-66' x='2115' y='0'%3e%3c/use%3e%3cuse transform='scale(0.707)' xlink:href='%23MJMAIN-72' x='2421' y='0'%3e%3c/use%3e%3cuse transform='scale(0.707)' xlink:href='%23MJMAIN-61' x='2814' y='0'%3e%3c/use%3e%3cuse transform='scale(0.707)' xlink:href='%23MJMAIN-6D' x='3314' y='0'%3e%3c/use%3e%3cuse transform='scale(0.707)' xlink:href='%23MJMAIN-65' x='4148' y='0'%3e%3c/use%3e%3c/g%3e%3c/g%3e%3c/g%3e%3c/g%3e%3c/g%3e%3c/g%3e%3c/svg%3e)
Interpretation: Longer capture durations may indicate difficulty aligning the strip, glare, focus issues or unstable cassette tracking. Compare by phone model and capture context before assigning a cause.
Spreadsheet check: =FinalLockTimestamp - FirstFrameTimestamp
Combined angular tilt
'%3e%3cg transform='translate(167%2c0)'%3e%3cg transform='translate(-13%2c0)'%3e%3cg transform='translate(0%2c-101)'%3e%3cuse xlink:href='%23MJMATHI-3B8' x='0' y='0'%3e%3c/use%3e%3cg transform='translate(469%2c-150)'%3e%3cuse transform='scale(0.707)' xlink:href='%23MJMAIN-74'%3e%3c/use%3e%3cuse transform='scale(0.707)' xlink:href='%23MJMAIN-69' x='389' y='0'%3e%3c/use%3e%3cuse transform='scale(0.707)' xlink:href='%23MJMAIN-6C' x='668' y='0'%3e%3c/use%3e%3cuse transform='scale(0.707)' xlink:href='%23MJMAIN-74' x='946' y='0'%3e%3c/use%3e%3c/g%3e%3cuse xlink:href='%23MJMAIN-3D' x='1791' y='0'%3e%3c/use%3e%3cg transform='translate(2848%2c0)'%3e%3cuse xlink:href='%23MJSZ2-221A' x='0' y='70'%3e%3c/use%3e%3crect stroke='none' width='6107' height='60' x='1000' y='1161'%3e%3c/rect%3e%3cg transform='translate(1000%2c0)'%3e%3cuse xlink:href='%23MJMAIN-70'%3e%3c/use%3e%3cuse xlink:href='%23MJMAIN-69' x='556' y='0'%3e%3c/use%3e%3cuse xlink:href='%23MJMAIN-74' x='835' y='0'%3e%3c/use%3e%3cuse xlink:href='%23MJMAIN-63' x='1224' y='0'%3e%3c/use%3e%3cuse xlink:href='%23MJMAIN-68' x='1669' y='0'%3e%3c/use%3e%3cuse transform='scale(0.707)' xlink:href='%23MJMAIN-32' x='3147' y='598'%3e%3c/use%3e%3cuse xlink:href='%23MJMAIN-2B' x='2901' y='0'%3e%3c/use%3e%3cg transform='translate(3902%2c0)'%3e%3cuse xlink:href='%23MJMAIN-79'%3e%3c/use%3e%3cuse xlink:href='%23MJMAIN-61' x='528' y='0'%3e%3c/use%3e%3cuse xlink:href='%23MJMAIN-77' x='1029' y='0'%3e%3c/use%3e%3cuse transform='scale(0.707)' xlink:href='%23MJMAIN-32' x='2476' y='583'%3e%3c/use%3e%3c/g%3e%3c/g%3e%3c/g%3e%3c/g%3e%3c/g%3e%3c/g%3e%3c/g%3e%3c/svg%3e)
Interpretation: This combines vertical and horizontal orientation into one angle-like stability measure. High values can indicate perspective distortion risk, especially for multi-strip layouts or small regions of interest.
Spreadsheet check: =SQRT(Pitch^2 + Yaw^2)
Frame-fit stability rate
'%3e%3cg transform='translate(167%2c0)'%3e%3cg transform='translate(-13%2c0)'%3e%3cuse xlink:href='%23MJMATHI-52' x='0' y='0'%3e%3c/use%3e%3cg transform='translate(759%2c-150)'%3e%3cuse transform='scale(0.707)' xlink:href='%23MJMAIN-73'%3e%3c/use%3e%3cuse transform='scale(0.707)' xlink:href='%23MJMAIN-74' x='394' y='0'%3e%3c/use%3e%3cuse transform='scale(0.707)' xlink:href='%23MJMAIN-61' x='784' y='0'%3e%3c/use%3e%3cuse transform='scale(0.707)' xlink:href='%23MJMAIN-62' x='1284' y='0'%3e%3c/use%3e%3cuse transform='scale(0.707)' xlink:href='%23MJMAIN-6C' x='1841' y='0'%3e%3c/use%3e%3cuse transform='scale(0.707)' xlink:href='%23MJMAIN-65' x='2119' y='0'%3e%3c/use%3e%3c/g%3e%3cuse xlink:href='%23MJMAIN-3D' x='2950' y='0'%3e%3c/use%3e%3cg transform='translate(4006%2c0)'%3e%3cuse xlink:href='%23MJSZ3-28'%3e%3c/use%3e%3cg transform='translate(736%2c0)'%3e%3cg transform='translate(120%2c0)'%3e%3crect stroke='none' width='4819' height='60' x='0' y='220'%3e%3c/rect%3e%3cg transform='translate(60%2c676)'%3e%3cuse xlink:href='%23MJMATHI-4E' x='0' y='0'%3e%3c/use%3e%3cg transform='translate(803%2c-155)'%3e%3cuse transform='scale(0.707)' xlink:href='%23MJMAIN-76'%3e%3c/use%3e%3cuse transform='scale(0.707)' xlink:href='%23MJMAIN-61' x='528' y='0'%3e%3c/use%3e%3cuse transform='scale(0.707)' xlink:href='%23MJMAIN-6C' x='1029' y='0'%3e%3c/use%3e%3cuse transform='scale(0.707)' xlink:href='%23MJMAIN-69' x='1307' y='0'%3e%3c/use%3e%3cuse transform='scale(0.707)' xlink:href='%23MJMAIN-64' x='1586' y='0'%3e%3c/use%3e%3cuse transform='scale(0.707)' xlink:href='%23MJMAIN-66' x='2496' y='0'%3e%3c/use%3e%3cuse transform='scale(0.707)' xlink:href='%23MJMAIN-72' x='2802' y='0'%3e%3c/use%3e%3cuse transform='scale(0.707)' xlink:href='%23MJMAIN-61' x='3195' y='0'%3e%3c/use%3e%3cuse transform='scale(0.707)' xlink:href='%23MJMAIN-6D' x='3695' y='0'%3e%3c/use%3e%3cuse transform='scale(0.707)' xlink:href='%23MJMAIN-65' x='4529' y='0'%3e%3c/use%3e%3cuse transform='scale(0.707)' xlink:href='%23MJMAIN-73' x='4973' y='0'%3e%3c/use%3e%3c/g%3e%3c/g%3e%3cg transform='translate(89%2c-686)'%3e%3cuse xlink:href='%23MJMATHI-4E' x='0' y='0'%3e%3c/use%3e%3cg transform='translate(803%2c-155)'%3e%3cuse transform='scale(0.707)' xlink:href='%23MJMAIN-74'%3e%3c/use%3e%3cuse transform='scale(0.707)' xlink:href='%23MJMAIN-6F' x='389' y='0'%3e%3c/use%3e%3cuse transform='scale(0.707)' xlink:href='%23MJMAIN-74' x='890' y='0'%3e%3c/use%3e%3cuse transform='scale(0.707)' xlink:href='%23MJMAIN-61' x='1279' y='0'%3e%3c/use%3e%3cuse transform='scale(0.707)' xlink:href='%23MJMAIN-6C' x='1780' y='0'%3e%3c/use%3e%3cuse transform='scale(0.707)' xlink:href='%23MJMAIN-66' x='2412' y='0'%3e%3c/use%3e%3cuse transform='scale(0.707)' xlink:href='%23MJMAIN-72' x='2718' y='0'%3e%3c/use%3e%3cuse transform='scale(0.707)' xlink:href='%23MJMAIN-61' x='3111' y='0'%3e%3c/use%3e%3cuse transform='scale(0.707)' xlink:href='%23MJMAIN-6D' x='3611' y='0'%3e%3c/use%3e%3cuse transform='scale(0.707)' xlink:href='%23MJMAIN-65' x='4445' y='0'%3e%3c/use%3e%3cuse transform='scale(0.707)' xlink:href='%23MJMAIN-73' x='4889' y='0'%3e%3c/use%3e%3c/g%3e%3c/g%3e%3c/g%3e%3c/g%3e%3cuse xlink:href='%23MJSZ3-29' x='5795' y='-1'%3e%3c/use%3e%3c/g%3e%3cuse xlink:href='%23MJMAIN-D7' x='10761' y='0'%3e%3c/use%3e%3cg transform='translate(11761%2c0)'%3e%3cuse xlink:href='%23MJMAIN-31'%3e%3c/use%3e%3cuse xlink:href='%23MJMAIN-30' x='500' y='0'%3e%3c/use%3e%3cuse xlink:href='%23MJMAIN-30' x='1001' y='0'%3e%3c/use%3e%3c/g%3e%3c/g%3e%3c/g%3e%3c/g%3e%3c/svg%3e)
Interpretation: This is the proportion of preview frames where the cassette or strip tracking algorithm reports a valid fit state. Low stability can indicate user hand movement, glare, boundary instability or device/camera focus issues.
Spreadsheet check: =(ValidFrameCount / TotalFrameCount) * 100