
|
Novarum DX Ltd
|
Document ID: IFU033
|
This guide shows you how to access, interpret, and manage assay results in the RARE web portal and mobile app. You’ll learn how to find specific results, understand their context, and export data for further analysis or documentation.
Results Management
The Results feature is your central hub for viewing all assay results uploaded to your RARE workspace.
It lets you:
-
Browse and search results from all uploaded runs and datasets.
-
Filter by date, method, batch, user, or result status to quickly find what you need.
-
View detailed result pages, including images, profile charts, and configuration lineage.
-
Export results (individually or in bulk) for offline analysis or regulatory submission.
-
Maintain full traceability—every result is linked to its source data, configuration, and processing history.
This feature supports scientists, QC operators, and regulatory users in tracking assay performance, investigating outliers, and preparing data for audits or validation studies.
How Results relate to other parts of RARE
You don’t need to understand all of these to use the Results screen, but they explain what you’re seeing and why some fields appear.
-
Result – A single assay outcome, including:
-
Captured images
-
Quantitative values (e.g. line intensities, ratios, concentration)
-
Qualitative calls (e.g. “Positive”, “Negative”)
-
Metadata (time, method, batch, classifier, user, device)
-
-
Run – A named execution that can contain multiple results (e.g. “Study 001 – Day 1”). In the Results table, you often filter or group by run.
-
Dataset – A collection of results grouped for analysis or re‑processing (for example, a validation dataset). Datasets are particularly relevant on the Ground Truth and Classifiers pages.
-
Ground truth – A reference label for a result (e.g. “Positive”, “Negative”) used for validation and performance calculations.
-
Ground truths are typically set or reviewed in dedicated tools/pages, not directly from the Results screen.
-
When present, the Result view can show both the system interpretation and the ground truth for comparison.
-
-
Batch configuration – Defines calibration and quantitative parameters for a particular assay batch. The Result view records which batch was used, so you can trace back to how signals were transformed quantitatively.
-
Classifier configuration – Defines how raw signals become qualitative calls (cut‑offs, decision rules, multi‑line logic). The Result view records the classifier version used to interpret that result qualitatively.
For more detail on how ground truths, batches, and classifiers are created and maintained, see Configurations
Using the Results page
Open the Results page
-
In the left-hand sidebar, go to Results.
-
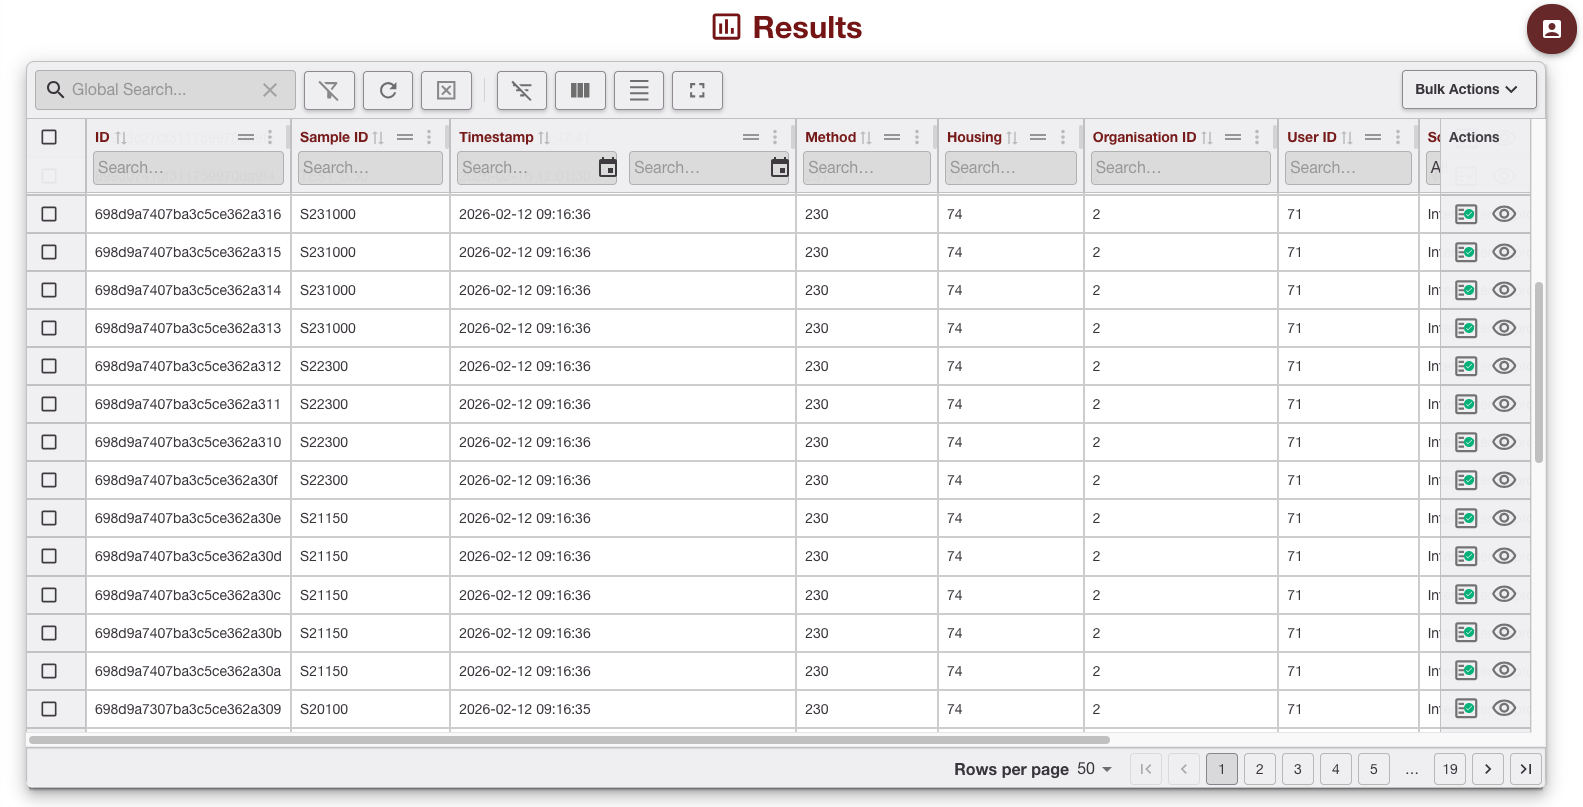
You’ll see a table of results you have permission to view
-
The table typically includes:
-
Run or sample ID
-
Date / time
-
Method / batch / classifier references
-
Main qualitative interpretation (e.g. Positive / Negative / Invalid)
-
Filter and Search
You can also use the search bar to:
-
find a specific run ID or sample ID
-
find a partial ID or name string
-
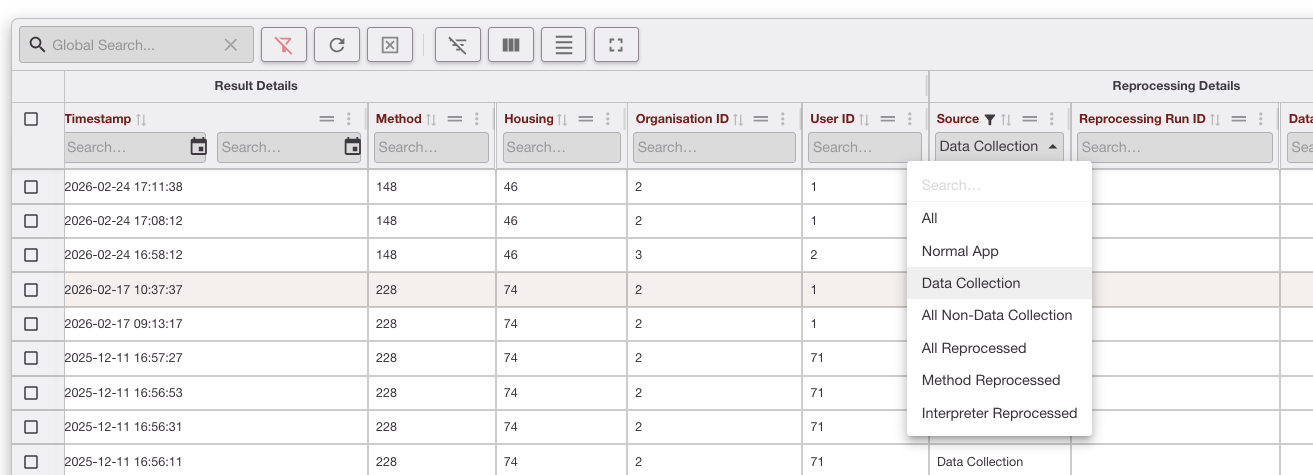
combine filters and search from any column header to get down to exactly the records you need

-
Results from different Sources can be retrieved (e.g. Data Collection, All Reprocessed, ..)
Tip: Start with a broad filter (e.g. date range + method) and then narrow by batch or user.
Open and review a result
To see the full Result view click any row in the Results table to open the Result detail page.
The way a result is displayed in the portal is determined by the result type, which is fixed at the moment the result is created. This result type comes from the Method’s Data Collection Mode setting (see Configurations ) which is sent to the app.
The view is chosen entirely by the information stored in the result (its type), which is determined by the Method’s Data Collection Mode at the time of capture.
You cannot switch a stored result between Data Collector view and Full result view after it has been created.
Data Collection Mode ON
The app runs in data collection mode.
-
The app applies data collection and returns a PMF Story to the portal.
-
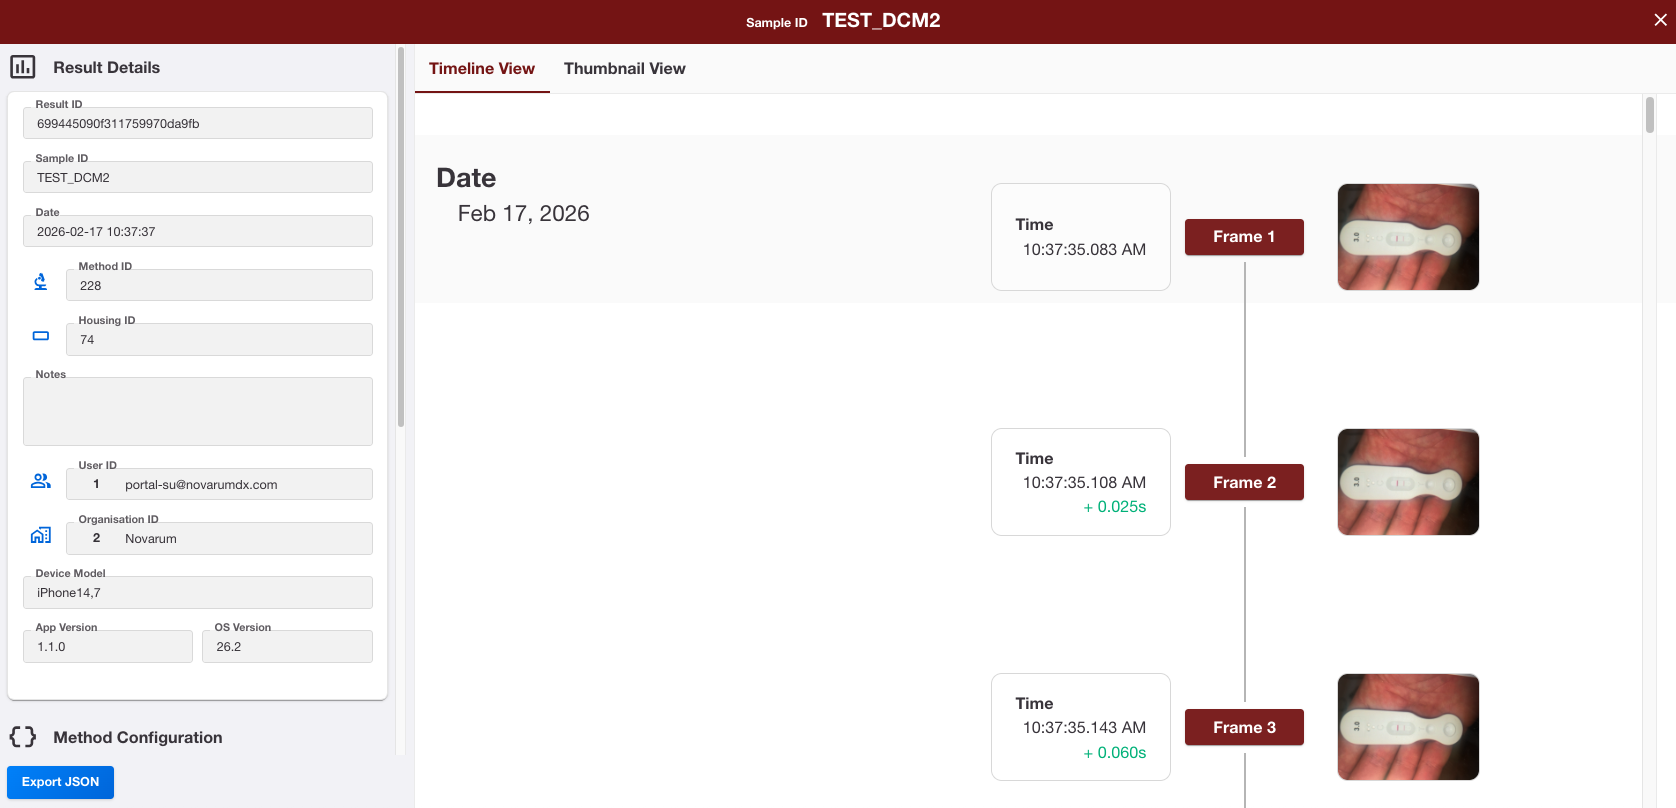
When you open the result in the portal, you see the Data Collector result view, with:
-
A Timeline tab
-
A Thumbnail tab
-
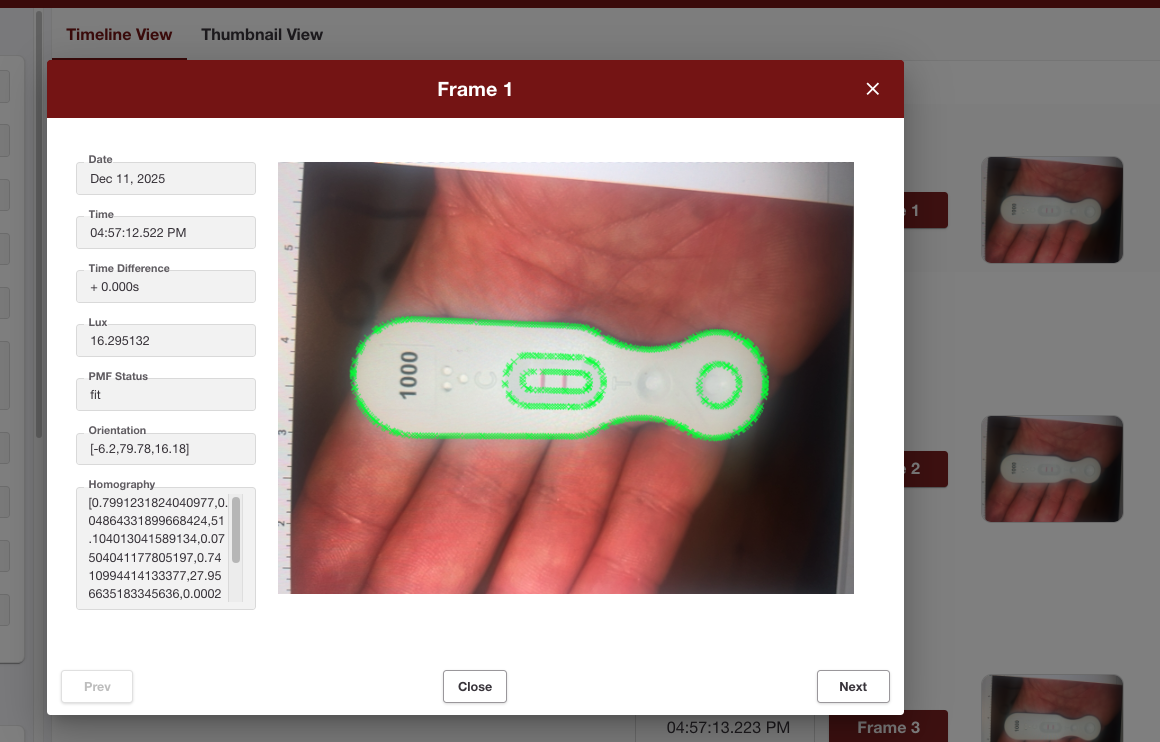
This view is optimised for reviewing a sequence of images and their capture timeline.
Data Collection Mode OFF
The app extracts a peak profile from the ROI (Region of Interest) instead of returning a PMF Story.
-
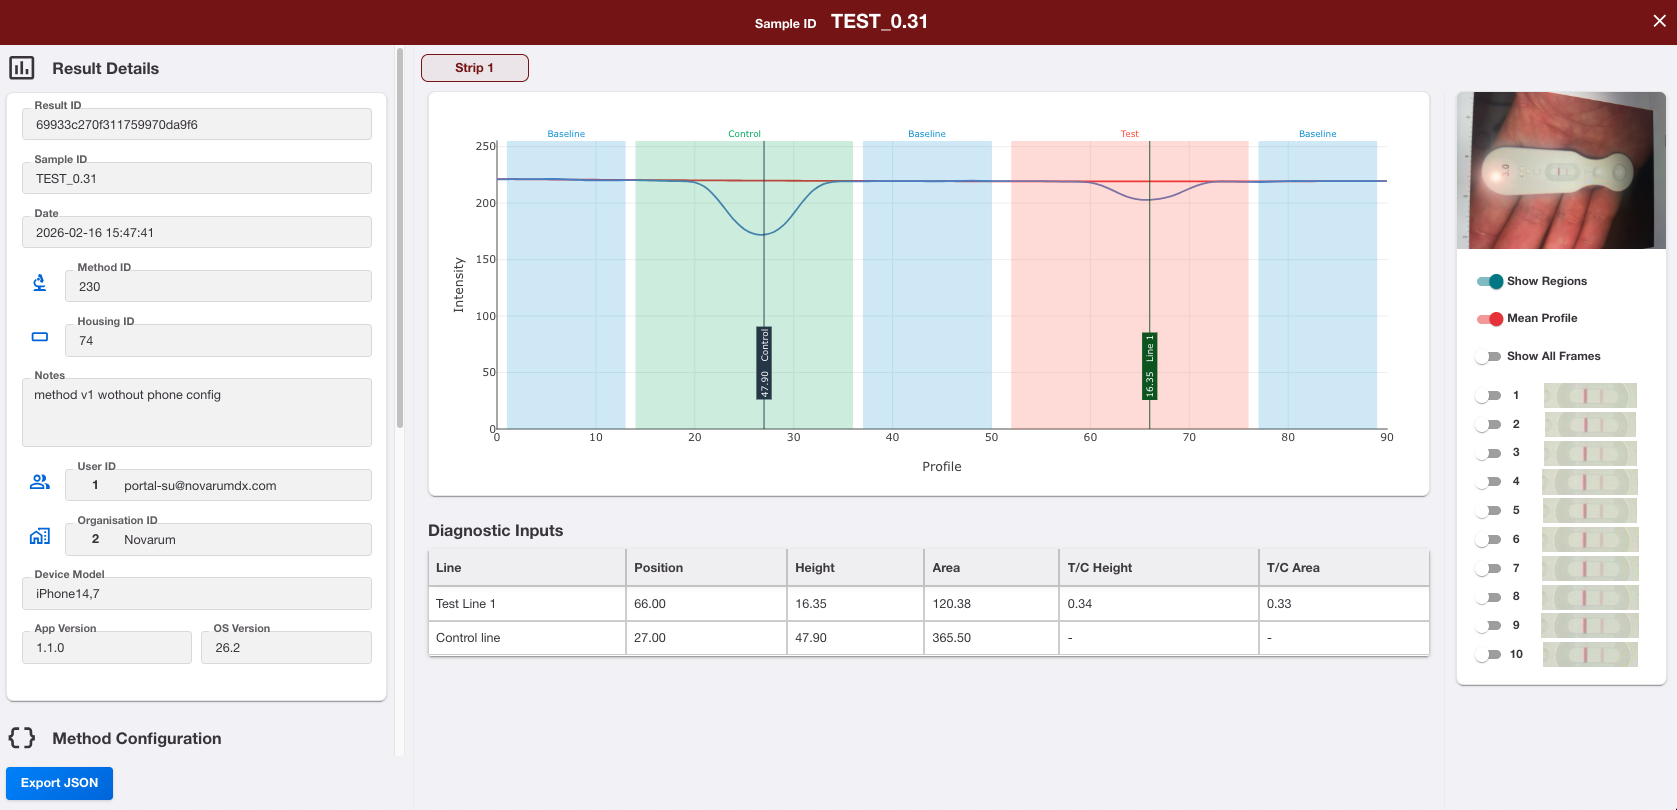
When you open the result in the portal, you see the Full result view, which shows:
-
The profile and extracted peak information
-
Quantitative outputs derived from that profile
-
You will not see the Timeline and Thumbnail tabs for these results.
Check the image(s)
-
For Data Collector view:
-
Review the image sequence using the Timeline and Thumbnail tabs.
-
-
For Full result view:
-
Review the captured image(s) together with the profile and extracted peak information.
-
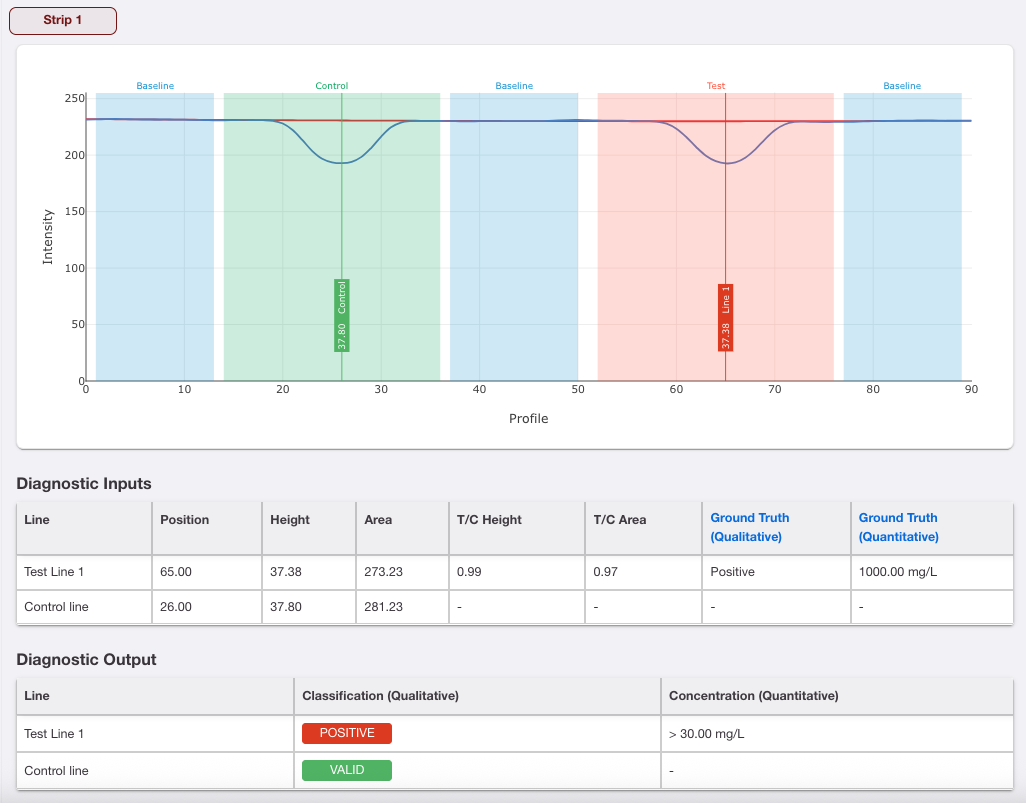
Review the interpretation outputs
Quantitative values (e.g. line intensities, ratios, calculated quantities)
-
Qualitative interpretations (e.g. “Positive”, “Negative”, “Invalid”)
-
Any additional interpreter outputs configured for your assay
Review metadata and configuration traceability
-
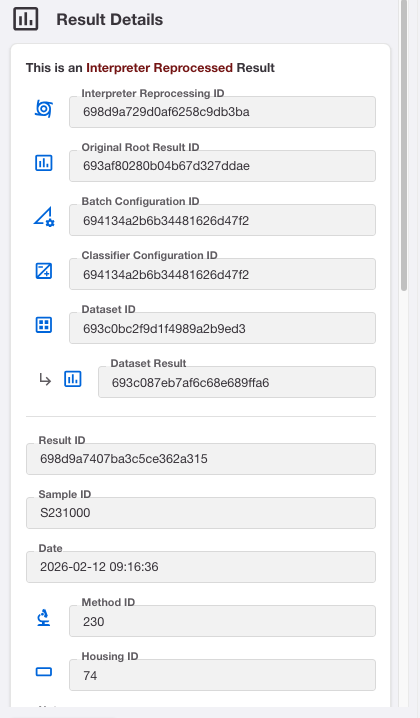
Method, batch, and classifier used
-
Date/time, device, and user who collected the result
-
Links to related entities (batches, classifiers, ground truths, datasets)
Compare with ground truth (if available)
See how the system’s interpretation lines up with the assigned ground truth. This is especially important when reviewing validation datasets
Export Results
Single result JSON
From a Result detail
-
Click Export JSON to download data in JSON format.
-
The result will be output with layout:
{
    "_id": "698d9a7407ba3c5ce362a315",
    "sample_id": "S231000",
    "timestamp": "2026-02-12T09:16:36.192949Z",
    "datarun_id": "698d9a729d0af6258c9db3ba",
    "datarun_type": "interpreter",
    "batch_id": "694134a2b6b34481626d47f2",
    "classifier_id": "698d99df07ba3c5ce362a2b3",
    "source_result": {
        "id": "693c087eb7af6c68e689ffa6",
        "images": [],
        "rejected_images": [],
        "analysis_number": 0,
        "dataset_id": "693c0bc2f9d1f4989a2b9ed3"
    },
    "longitude": 56.0746807,
    "latitude": -3.4614342,
    "device_model": "iPhone14,7",
    "device_platform": null,
    "device_manufacturer": null,
    "device_uuid": "7B04A8E7-2156-4BC8-A4DF-52E1D46FE73F",
    "os_version": "18.6.2",
    "app_version": "1.1.0",
    "app_build": 0,
    "notes": "",
    "method_id": 230,
    "housing_id": 74,
    "type": "COMPLETED",
    "test_configuration": {

    },
    "test_strips": [

    ],
    "pmf_story": [],
    "organisation_id": 2,
    "user_id": 71,
    "ground_truth_id": "69837304559d7b11bcfaa9d1",
    "ground_truth_source": "manual_review",
    "ground_truth_unit": "mg/L",
    "has_ground_truth": true
}
Bulk export
-
From the Results management list, apply filters first to narrow your selection.
-
Select one or more results using the checkboxes.
-
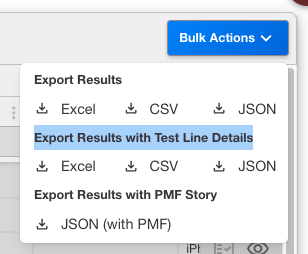
Click Bulk Actions
-
Select one of the options to download data in Excel or JSON format.
After You’ve Done This
Once you have reviewed and/or exported results, you can:
-
Investigate performance – Use exports with your preferred tools to generate performance metrics (sensitivity, specificity, etc.) using ground truths and interpreter outputs
-
Trace outliers – Use the Result detail view and configuration lineage to understand why a particular result looks unusual
-
Support validation and audits – Provide tables of results, including which batch and classifier versions were used, for regulators or internal reviewers
Tips
-
Use consistent naming for runs, batches, and methods to make filtering and searching easier.
-
When working with large datasets, test your export settings on a small subset first.
-
Use the full Result view when you need to understand why a result has a particular interpretation.
-
If you are working on classifier or batch tuning, keep the Results page open in one tab and the Classifiers or Batches page in another.