
|
Novarum DX Ltd
|
Document ID: IFU042
|
Use this feature to manage, view, and analyze the diagnostic performance of your assays. It allows you to review previously generated reports or create new ones to evaluate how your configurations perform against real-world data.
What is Performance Reports Management?
The Performance Reports Management page is your central hub for data analysis in the RARE portal. It transforms raw assay data into actionable regulatory and scientific insights by evaluating how your Qualitative Classifiers and Quantitative Batch Configurations perform against a known Ground Truth.
By centralizing these reports, RARE ensures full traceability between your raw datasets, the specific configurations applied to them, and the resulting performance outcomes.
Why use Performance Reports?
A Performance Report acts as a "snapshot in time," capturing exactly how a specific version of your interpreter performed on a specific set of samples. This is essential for:
-
Method Validation: Providing the statistical evidence needed for regulatory filings.
-
Configuration Tuning: Comparing different threshold settings or calibration curves to find the optimal balance of sensitivity and precision.
-
Quality Control: Monitoring batch-to-batch consistency and identifying potential manufacturing drift.
Key concepts
-
Performance Report – A generated document or view that summarizes diagnostic and analytical metrics for a specific dataset and configuration.
-
Dataset – The collection of original results and images used as the input for the report.
-
Qualitative Classifier – The interpretation configuration (rules and thresholds) applied to determine qualitative results.
-
Quantitative Batch ID – The specific batch configuration (calibration parameters) used for quantitative analysis.
-
Ground Truth – The reference labels (e.g., known positive/negative) used to calculate the accuracy of the interpreter's results.
Managing your Reports
Accessing Performance Reports
You can find your reports by navigating to the sidebar in the RARE web portal:
Sidebar → Data Analysis → Performance Reports
What you can see and do on this page depends on your user role and subscription level.
Understanding the report list
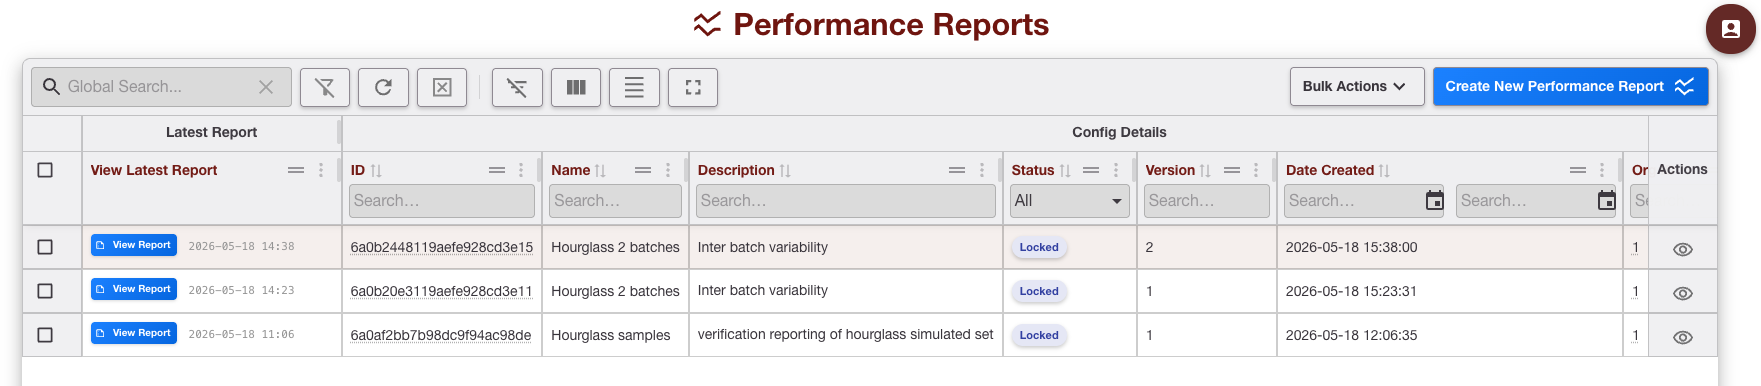
The main area of the page displays a tabular list of all generated reports. This list is designed to provide an immediate audit trail of your analysis history. For each report, you will see:
-
"Latest Report" column group showing the most recent generation status/timestamp
-
Report Name/ID: The unique identifier for the analysis.
-
Description: A brief note (if provided) explaining the context of the report.
-
Status (DRAFT = saved but never generated; LOCKED = generated at least once; ARCHIVED = soft-deleted)
-
Version
-
Created: The exact date and timestamp when the report was generated.
-
Org ID
-
User ID
-
Datasets: The identifier(s) of the data used for the analysis.
-
Classifier and Batch columns: The specific versions of the Qualitative Classifier and Quantitative Batch ID applied.
Filtering and sorting reports
To help you find specific analyses in a growing list, you can use the built-in filters.
Filter
You can narrow down the list using the following criteria, among others:
-
Report Date: Select a "From" and "To" date range to see reports created within a specific period.
-
Qualitative Classifier: Filter by the specific interpretation configuration ID.
-
Quantitative Batch: Filter by the specific batch or calibration configuration ID.
Sort
The list can be sorted by clicking the column headers (e.g., sorting by Created date to see the most recent analyses at the top).
Actions available
Each row in the list includes an Actions control (typically a three-dot menu or button) that allows you to:
-
Click the Create New Performance Report button at the top of the page to create a new configuration.
-
View Report Configuration: Opens the detailed report configuration view to examine metrics, charts, and result breakdowns.
-
Export list: Downloads the report the report list.
Creating a New Performance Report
Prerequisites
Before you begin, make sure you have:
-
A completed interpreter reprocessing Dataset: The dataset you want to use must already exist in the system, with all results finalized using an interpreter (at least one Batch Configuration and / or a Classifier Configuration).
-
Appropriate permissions: You must have access to create reports
-
Consistent assay types: All results in your chosen dataset must be compatible with the batch/classifier you intend to apply (the system will check this for you).
-
Consistent ground truths: All results in your chosen dataset must have aligned quantitative units / qualitative bins, and ground truths applied (the system will check this for you).
Step 1 - Describe Report
Start by giving your report a clear, descriptive name and a short explanation of its purpose. This helps with traceability and future audits.
-
Enter a clear Name (e.g., "QC Panel Diagnostic Mar 2026").
-
Add a Description to explain the purpose or context.

Use consistent naming conventions to make it easy to find and compare reports later.
Step 2 - Select Dataset
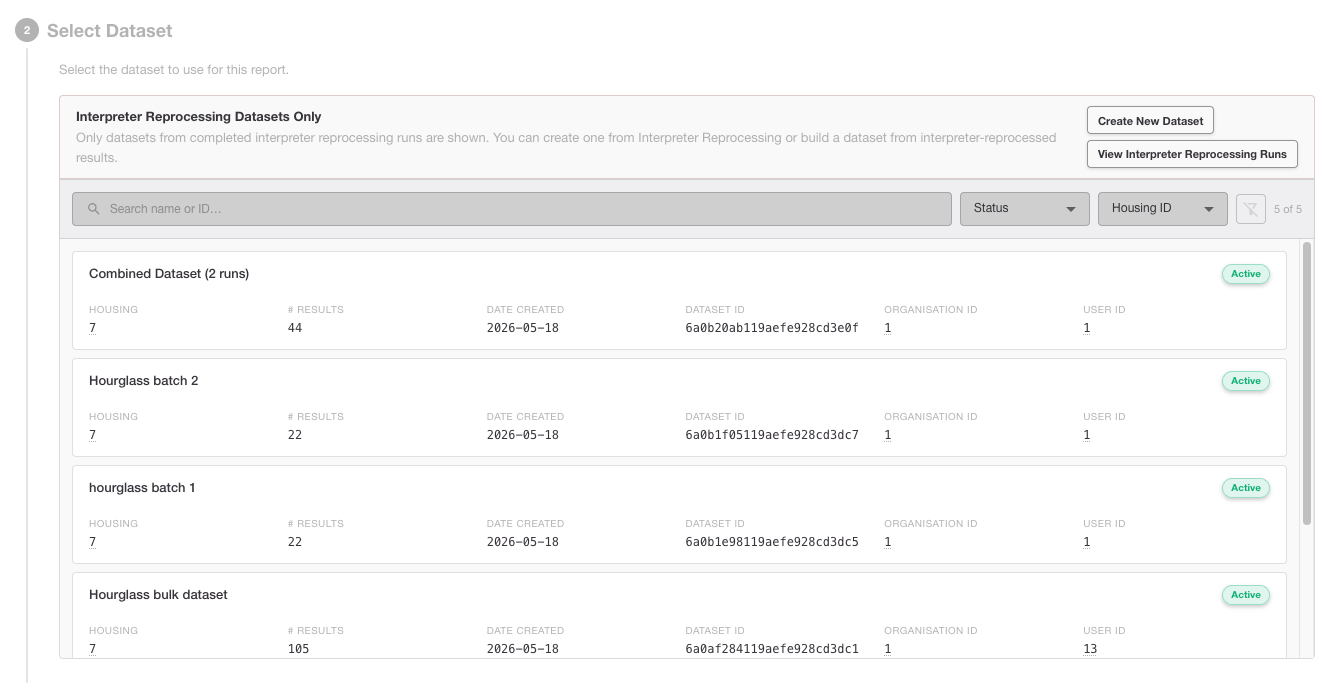
Choose the source data for your report. The system displays all datasets that have been through interpreter reprocessing and are eligible for performance analysis.
-
Browse the list of available datasets.
-
Use the Filter options to narrow down by date, assay type, or operator.
-
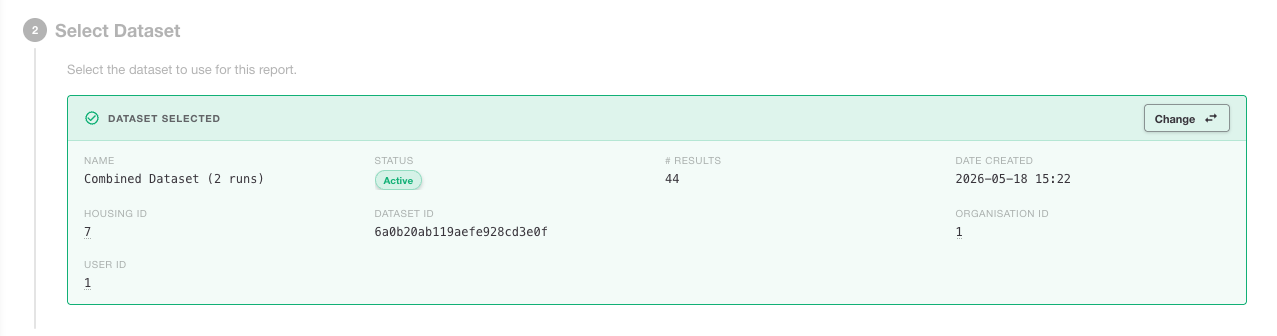
Click to select your target dataset. Once selected, it will be highlighted, and other options will be hidden.
-
If you need to change your mind, click the Change button to return to the full list.
Step 3 - Dataset Overview
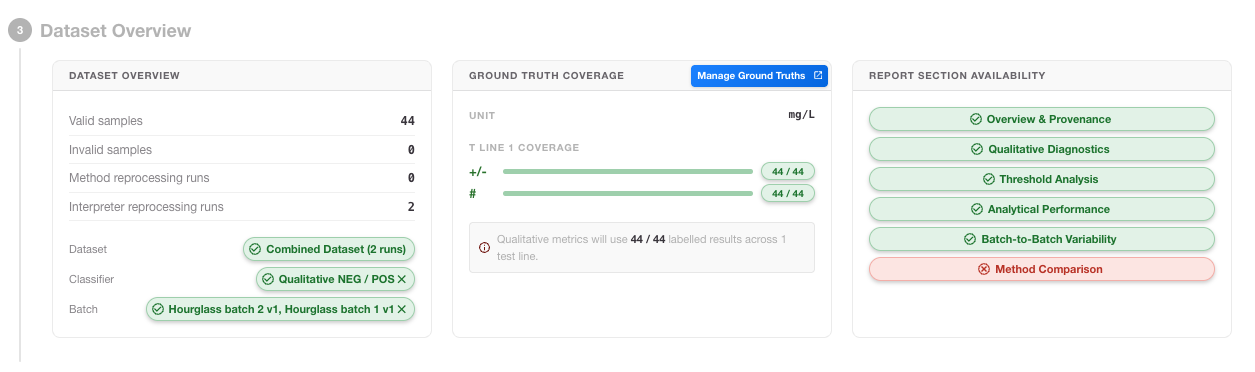
Before proceeding, review the summary of your selected dataset to ensure it contains the expected data.
-
Check the Total Results count and the breakdown of assay types.
-
Verify the Configurations (Batch and Classifier) that were used to generate these results.
-
Confirm that the Ground Truth status is "Applied" for the results you wish to analyze.
Step 4 - Ground Truth Mapping
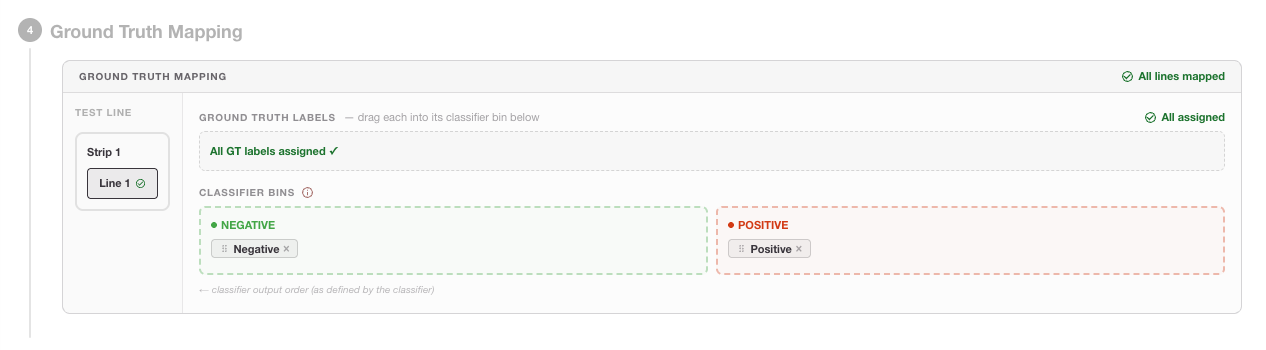
To calculate performance metrics like sensitivity and specificity, RARE needs to know which result labels correspond to your reference "Ground Truth." This mapping is flexible, allowing you to perform qualitative analysis on each specific threshold within your classifier.
Configuration Steps
-
Single strip, single test line: Map the interpreter's qualitative bins (e.g., "Positive", "Negative") to the Ground Truth categories.
-
Multiple strips / multiple test lines: For complex assays, ensure each test line is correctly mapped to its respective reference standard.
-
The system will validate that the mapping is complete before allowing you to move to the next step.
Mapping Multi-Bin Classifiers
If your classifier uses multiple bins (e.g., Low, Medium, and High), you can generate reports for different clinical scenarios by grouping these bins against your Ground Truth. This is achieved by mapping the thresholds between the bins:
-
Scenario A (Low vs. Others): You can map the first threshold so that Low is compared against a combined group of Medium + High.
-
Scenario B (High vs. Others): You can map the second threshold so that Low + Medium are grouped together and compared against High.
Step 5 - Report Sections
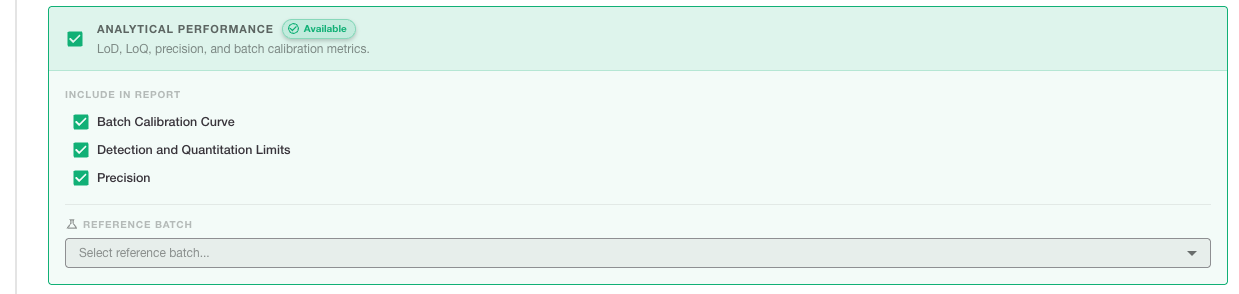
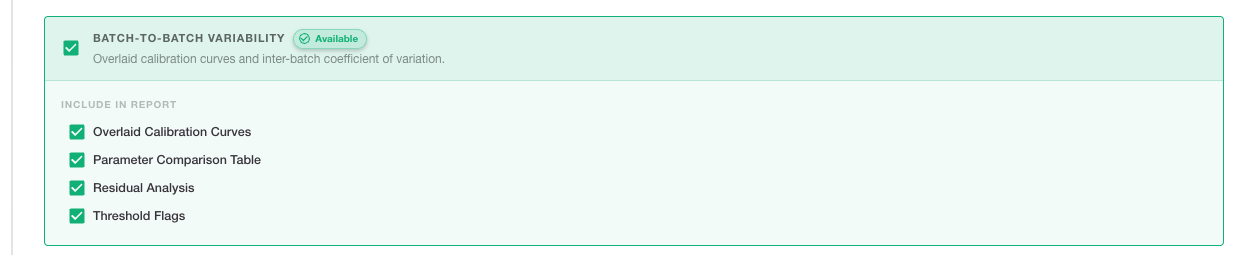
Customize your report by selecting the specific analysis modules you need. You can toggle these on or off based on your validation requirements:
-
Overview & Provenance: Includes metadata about the dataset, configurations, and the environment in which the report was generated.

-
Qualitative Diagnostic Metrics: Generates contingency tables (True Positives, False Negatives, etc.) and calculates Sensitivity, Specificity, and Accuracy.

-
Threshold Analysis: Includes ROC curves and threshold optimization tables to help you find the best cut-off points for your assay.

-
Analytical Performance: Focuses on quantitative precision, bias, and recovery metrics.
-
Batch-to-Batch Variability: Compares performance across different reagent lots or manufacturing batches if present in the dataset.
Step 6 - Review & Save
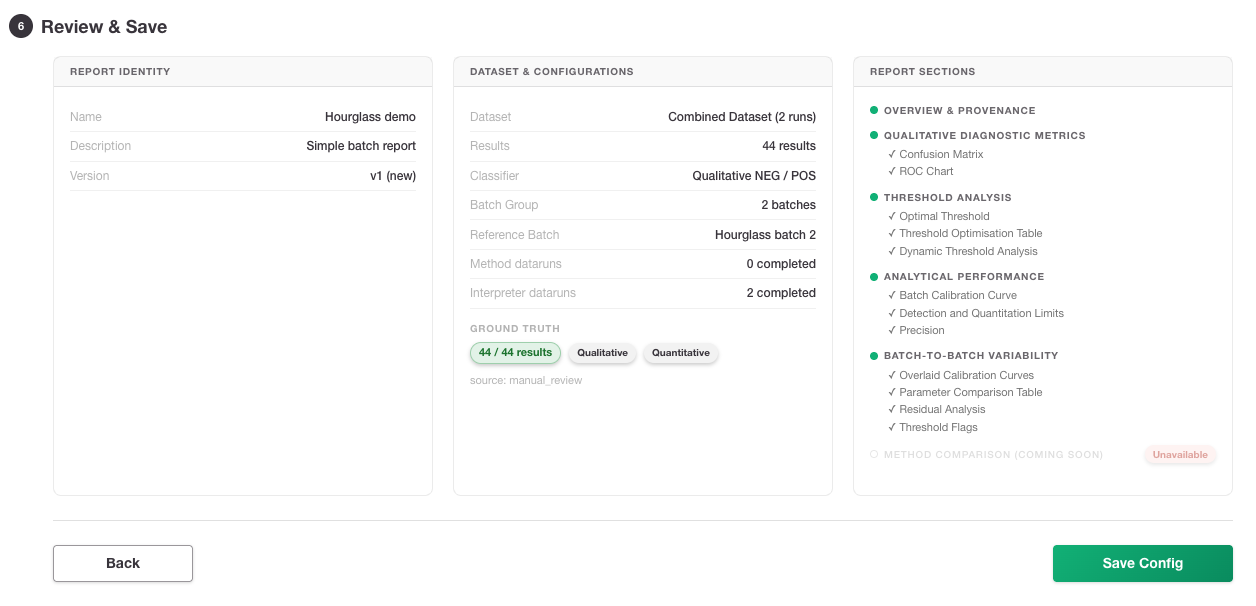
Review your configuration summary one last time.
-
Check that the report name, selected dataset, and chosen sections are correct.
-
Click Save Configuration to store these settings. This allows you to return to this specific setup later or share the configuration with colleagues.
Step 7 - Generate the report
After saving, the Generate Report button will appear at the bottom of the page.
-
Press Generate Report to start the calculation engine.
-
The system will process the data and create the final report view. Depending on the dataset size, this may take a few moments.
Interpreting Report Content
Diagnostic performance is considered for each test line, across multiple assay strips if present. The report is organized into modular chapters, providing both visual charts and detailed statistical tables to support your findings.
Every report is structured to ensure Full Traceability. The "Provenance" section identifies exactly which dataset and configuration versions were used, ensuring your conclusions are always backed by a clear audit trail.
The Four Pillars of RARE Analysis
-
Qualitative Diagnostic Metrics: The "Pass/Fail" performance of your assay (Sensitivity, Specificity, etc.).
-
Threshold Analysis: Advanced tools like ROC curves and Decision Plots to optimize your cut-off points.
-
Analytical Performance: Quantitative metrics including linearity, regression, and recovery.
-
Batch-to-Batch Variability: Comparative analysis to ensure robustness across different manufacturing lots.
Export PDF
Once the report is generated, you can take it offline for your records.
-
Press Export PDF at either the top or foot of the page.
-
The exported file includes all selected charts, tables, and provenance data, formatted for regulatory filing or internal sharing.
Overview & Provenance
The Overview & Provenance section serves as the definitive "technical passport" for your report, ensuring that every analysis is fully reproducible and audit-ready. By capturing a snapshot of the environment at the moment of generation, it eliminates ambiguity regarding which settings produced which results.
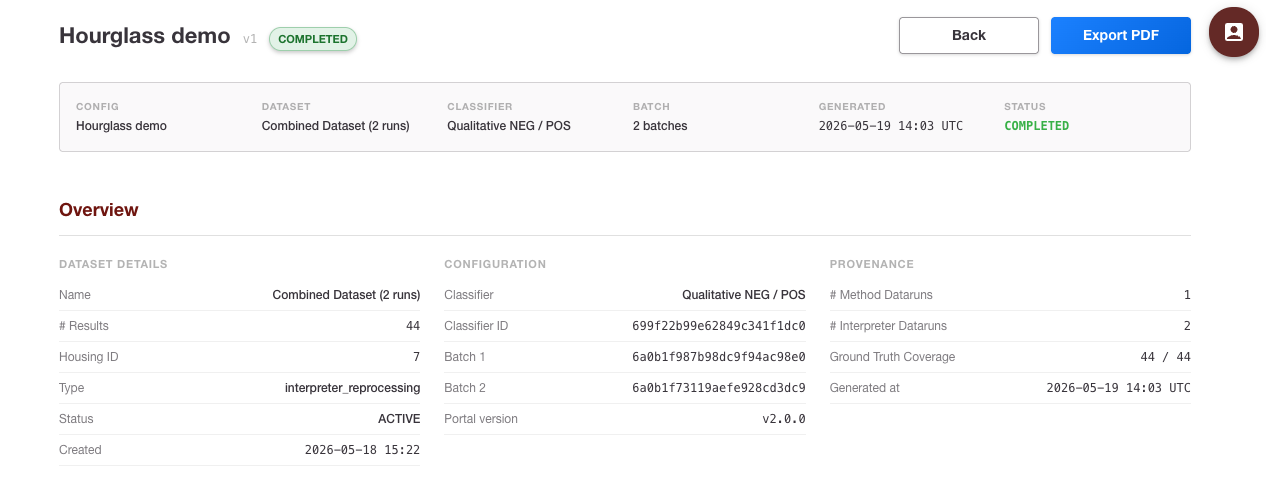
Based on the system configuration, this section details:
-
Report Metadata: Displays the unique Report ID, the name of the operator who generated it, and the exact completion timestamp.
-
Software Lineage: Lists the specific versions of the RARE Portal and Interpreter engine used, which is critical for maintaining compliance across software updates.
-
Configuration Traceability: Explicitly identifies the Qualitative Classifier and Quantitative Batch ID (including their specific version numbers) applied to the data.
-
Dataset Context: Summarizes the source dataset, including the total number of results analyzed and the specific assay types involved.
This level of detail ensures that if you ever need to defend a validation study or investigate a QC outlier, you have a clear, unalterable record of the logic and data used.
Qualitative Diagnostic Metrics
The Qualitative Diagnostic Metrics section provides the statistical foundation for your assay’s clinical performance. By comparing the interpreter’s results against your established Ground Truth, RARE generates a clear, objective view of how accurately the system identifies positive and negative samples.
This section is centered around a Contingency Table (or Confusion Matrix), which provides a visual breakdown of:
-
True Positives (TP): Correctly identified positive samples.
-
True Negatives (TN): Correctly identified negative samples.
-
False Positives (FP): Negative samples incorrectly labeled as positive.
-
False Negatives (FN): Positive samples incorrectly labeled as negative.
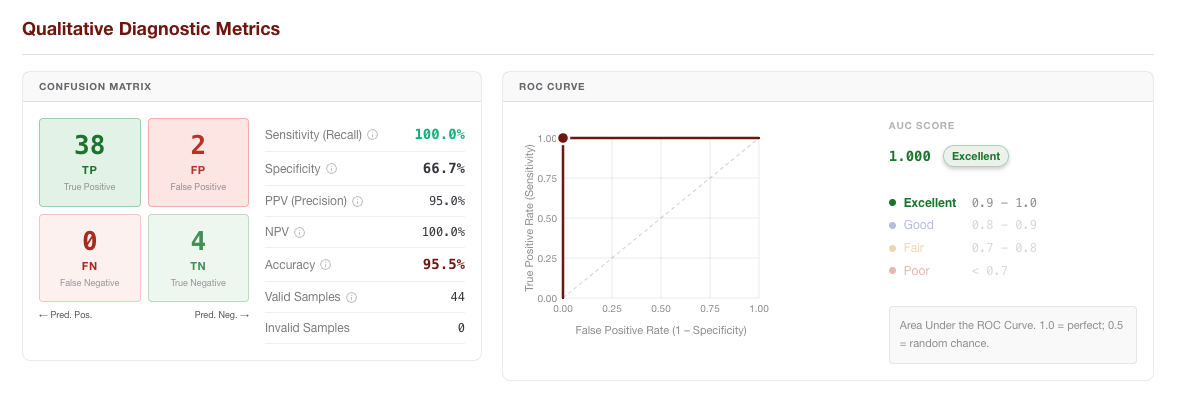
To ensure your performance reports meet the highest standards of transparency and regulatory rigor, RARE uses the following standard statistical definitions. These metrics are calculated by comparing the interpreter's results against the assigned Ground Truth.
Sensitivity (Positive Percent Agreement - PPA)
The proportion of actual positive samples that are correctly identified by the interpreter. It measures the assay's ability to avoid false negatives.
'%3e%3cg transform='translate(167%2c0)'%3e%3cg transform='translate(-13%2c0)'%3e%3cg transform='translate(0%2c28)'%3e%3cuse xlink:href='%23MJMAIN-53'%3e%3c/use%3e%3cuse xlink:href='%23MJMAIN-65' x='556' y='0'%3e%3c/use%3e%3cuse xlink:href='%23MJMAIN-6E' x='1001' y='0'%3e%3c/use%3e%3cuse xlink:href='%23MJMAIN-73' x='1557' y='0'%3e%3c/use%3e%3cuse xlink:href='%23MJMAIN-69' x='1952' y='0'%3e%3c/use%3e%3cuse xlink:href='%23MJMAIN-74' x='2230' y='0'%3e%3c/use%3e%3cuse xlink:href='%23MJMAIN-69' x='2620' y='0'%3e%3c/use%3e%3cuse xlink:href='%23MJMAIN-76' x='2898' y='0'%3e%3c/use%3e%3cuse xlink:href='%23MJMAIN-69' x='3427' y='0'%3e%3c/use%3e%3cuse xlink:href='%23MJMAIN-74' x='3705' y='0'%3e%3c/use%3e%3cuse xlink:href='%23MJMAIN-79' x='4095' y='0'%3e%3c/use%3e%3cuse xlink:href='%23MJMAIN-3D' x='4901' y='0'%3e%3c/use%3e%3cg transform='translate(5679%2c0)'%3e%3cg transform='translate(397%2c0)'%3e%3crect stroke='none' width='2858' height='60' x='0' y='220'%3e%3c/rect%3e%3cg transform='translate(914%2c420)'%3e%3cuse transform='scale(0.707)' xlink:href='%23MJMATHI-54' x='0' y='0'%3e%3c/use%3e%3cuse transform='scale(0.707)' xlink:href='%23MJMATHI-50' x='704' y='0'%3e%3c/use%3e%3c/g%3e%3cg transform='translate(60%2c-404)'%3e%3cuse transform='scale(0.707)' xlink:href='%23MJMATHI-54' x='0' y='0'%3e%3c/use%3e%3cuse transform='scale(0.707)' xlink:href='%23MJMATHI-50' x='704' y='0'%3e%3c/use%3e%3cuse transform='scale(0.707)' xlink:href='%23MJMAIN-2B' x='1456' y='0'%3e%3c/use%3e%3cuse transform='scale(0.707)' xlink:href='%23MJMATHI-46' x='2234' y='0'%3e%3c/use%3e%3cuse transform='scale(0.707)' xlink:href='%23MJMATHI-4E' x='2984' y='0'%3e%3c/use%3e%3c/g%3e%3c/g%3e%3c/g%3e%3c/g%3e%3c/g%3e%3c/g%3e%3c/g%3e%3c/svg%3e)
Specificity (Negative Percent Agreement - NPA)
The proportion of actual negative samples that are correctly identified by the interpreter. It measures the assay's ability to avoid false positives.
'%3e%3cg transform='translate(167%2c0)'%3e%3cg transform='translate(-13%2c0)'%3e%3cg transform='translate(0%2c28)'%3e%3cuse xlink:href='%23MJMAIN-53'%3e%3c/use%3e%3cuse xlink:href='%23MJMAIN-70' x='556' y='0'%3e%3c/use%3e%3cuse xlink:href='%23MJMAIN-65' x='1113' y='0'%3e%3c/use%3e%3cuse xlink:href='%23MJMAIN-63' x='1557' y='0'%3e%3c/use%3e%3cuse xlink:href='%23MJMAIN-69' x='2002' y='0'%3e%3c/use%3e%3cuse xlink:href='%23MJMAIN-66' x='2280' y='0'%3e%3c/use%3e%3cuse xlink:href='%23MJMAIN-69' x='2587' y='0'%3e%3c/use%3e%3cuse xlink:href='%23MJMAIN-63' x='2865' y='0'%3e%3c/use%3e%3cuse xlink:href='%23MJMAIN-69' x='3310' y='0'%3e%3c/use%3e%3cuse xlink:href='%23MJMAIN-74' x='3588' y='0'%3e%3c/use%3e%3cuse xlink:href='%23MJMAIN-79' x='3978' y='0'%3e%3c/use%3e%3cuse xlink:href='%23MJMAIN-3D' x='4784' y='0'%3e%3c/use%3e%3cg transform='translate(5562%2c0)'%3e%3cg transform='translate(397%2c0)'%3e%3crect stroke='none' width='2858' height='60' x='0' y='220'%3e%3c/rect%3e%3cg transform='translate(865%2c420)'%3e%3cuse transform='scale(0.707)' xlink:href='%23MJMATHI-54' x='0' y='0'%3e%3c/use%3e%3cuse transform='scale(0.707)' xlink:href='%23MJMATHI-4E' x='704' y='0'%3e%3c/use%3e%3c/g%3e%3cg transform='translate(60%2c-404)'%3e%3cuse transform='scale(0.707)' xlink:href='%23MJMATHI-54' x='0' y='0'%3e%3c/use%3e%3cuse transform='scale(0.707)' xlink:href='%23MJMATHI-4E' x='704' y='0'%3e%3c/use%3e%3cuse transform='scale(0.707)' xlink:href='%23MJMAIN-2B' x='1593' y='0'%3e%3c/use%3e%3cuse transform='scale(0.707)' xlink:href='%23MJMATHI-46' x='2371' y='0'%3e%3c/use%3e%3cuse transform='scale(0.707)' xlink:href='%23MJMATHI-50' x='3121' y='0'%3e%3c/use%3e%3c/g%3e%3c/g%3e%3c/g%3e%3c/g%3e%3c/g%3e%3c/g%3e%3c/g%3e%3c/svg%3e)
Positive Predictive Value (PPV)
The probability that a sample identified as positive by the interpreter is truly positive. This indicates the reliability of a positive result.
'%3e%3cg transform='translate(167%2c0)'%3e%3cg transform='translate(-13%2c0)'%3e%3cg transform='translate(0%2c28)'%3e%3cuse xlink:href='%23MJMAIN-50'%3e%3c/use%3e%3cuse xlink:href='%23MJMAIN-50' x='681' y='0'%3e%3c/use%3e%3cuse xlink:href='%23MJMAIN-56' x='1363' y='0'%3e%3c/use%3e%3cuse xlink:href='%23MJMAIN-3D' x='2391' y='0'%3e%3c/use%3e%3cg transform='translate(3169%2c0)'%3e%3cg transform='translate(397%2c0)'%3e%3crect stroke='none' width='2761' height='60' x='0' y='220'%3e%3c/rect%3e%3cg transform='translate(865%2c420)'%3e%3cuse transform='scale(0.707)' xlink:href='%23MJMATHI-54' x='0' y='0'%3e%3c/use%3e%3cuse transform='scale(0.707)' xlink:href='%23MJMATHI-50' x='704' y='0'%3e%3c/use%3e%3c/g%3e%3cg transform='translate(60%2c-404)'%3e%3cuse transform='scale(0.707)' xlink:href='%23MJMATHI-54' x='0' y='0'%3e%3c/use%3e%3cuse transform='scale(0.707)' xlink:href='%23MJMATHI-50' x='704' y='0'%3e%3c/use%3e%3cuse transform='scale(0.707)' xlink:href='%23MJMAIN-2B' x='1456' y='0'%3e%3c/use%3e%3cuse transform='scale(0.707)' xlink:href='%23MJMATHI-46' x='2234' y='0'%3e%3c/use%3e%3cuse transform='scale(0.707)' xlink:href='%23MJMATHI-50' x='2984' y='0'%3e%3c/use%3e%3c/g%3e%3c/g%3e%3c/g%3e%3c/g%3e%3c/g%3e%3c/g%3e%3c/g%3e%3c/svg%3e)
Negative Predictive Value (NPV)
The probability that a sample identified as negative by the interpreter is truly negative. This indicates the reliability of a negative result.
'%3e%3cg transform='translate(167%2c0)'%3e%3cg transform='translate(-13%2c0)'%3e%3cg transform='translate(0%2c28)'%3e%3cuse xlink:href='%23MJMAIN-4E'%3e%3c/use%3e%3cuse xlink:href='%23MJMAIN-50' x='750' y='0'%3e%3c/use%3e%3cuse xlink:href='%23MJMAIN-56' x='1432' y='0'%3e%3c/use%3e%3cuse xlink:href='%23MJMAIN-3D' x='2460' y='0'%3e%3c/use%3e%3cg transform='translate(3238%2c0)'%3e%3cg transform='translate(397%2c0)'%3e%3crect stroke='none' width='2955' height='60' x='0' y='220'%3e%3c/rect%3e%3cg transform='translate(914%2c420)'%3e%3cuse transform='scale(0.707)' xlink:href='%23MJMATHI-54' x='0' y='0'%3e%3c/use%3e%3cuse transform='scale(0.707)' xlink:href='%23MJMATHI-4E' x='704' y='0'%3e%3c/use%3e%3c/g%3e%3cg transform='translate(60%2c-404)'%3e%3cuse transform='scale(0.707)' xlink:href='%23MJMATHI-54' x='0' y='0'%3e%3c/use%3e%3cuse transform='scale(0.707)' xlink:href='%23MJMATHI-4E' x='704' y='0'%3e%3c/use%3e%3cuse transform='scale(0.707)' xlink:href='%23MJMAIN-2B' x='1593' y='0'%3e%3c/use%3e%3cuse transform='scale(0.707)' xlink:href='%23MJMATHI-46' x='2371' y='0'%3e%3c/use%3e%3cuse transform='scale(0.707)' xlink:href='%23MJMATHI-4E' x='3121' y='0'%3e%3c/use%3e%3c/g%3e%3c/g%3e%3c/g%3e%3c/g%3e%3c/g%3e%3c/g%3e%3c/g%3e%3c/svg%3e)
Overall Accuracy
The proportion of all samples (both positive and negative) that were correctly identified by the interpreter.
'%3e%3cg transform='translate(167%2c0)'%3e%3cg transform='translate(-13%2c0)'%3e%3cuse xlink:href='%23MJMAIN-41'%3e%3c/use%3e%3cuse xlink:href='%23MJMAIN-63' x='750' y='0'%3e%3c/use%3e%3cuse xlink:href='%23MJMAIN-63' x='1195' y='0'%3e%3c/use%3e%3cuse xlink:href='%23MJMAIN-75' x='1639' y='0'%3e%3c/use%3e%3cuse xlink:href='%23MJMAIN-72' x='2196' y='0'%3e%3c/use%3e%3cuse xlink:href='%23MJMAIN-61' x='2588' y='0'%3e%3c/use%3e%3cuse xlink:href='%23MJMAIN-63' x='3089' y='0'%3e%3c/use%3e%3cuse xlink:href='%23MJMAIN-79' x='3533' y='0'%3e%3c/use%3e%3cuse xlink:href='%23MJMAIN-3D' x='4339' y='0'%3e%3c/use%3e%3cg transform='translate(5118%2c0)'%3e%3cg transform='translate(397%2c0)'%3e%3crect stroke='none' width='6147' height='60' x='0' y='220'%3e%3c/rect%3e%3cg transform='translate(1720%2c478)'%3e%3cuse transform='scale(0.707)' xlink:href='%23MJMATHI-54' x='0' y='0'%3e%3c/use%3e%3cuse transform='scale(0.707)' xlink:href='%23MJMATHI-50' x='704' y='0'%3e%3c/use%3e%3cuse transform='scale(0.707)' xlink:href='%23MJMAIN-2B' x='1456' y='0'%3e%3c/use%3e%3cuse transform='scale(0.707)' xlink:href='%23MJMATHI-54' x='2234' y='0'%3e%3c/use%3e%3cuse transform='scale(0.707)' xlink:href='%23MJMATHI-4E' x='2939' y='0'%3e%3c/use%3e%3c/g%3e%3cg transform='translate(60%2c-404)'%3e%3cuse transform='scale(0.707)' xlink:href='%23MJMATHI-54' x='0' y='0'%3e%3c/use%3e%3cuse transform='scale(0.707)' xlink:href='%23MJMATHI-50' x='704' y='0'%3e%3c/use%3e%3cuse transform='scale(0.707)' xlink:href='%23MJMAIN-2B' x='1456' y='0'%3e%3c/use%3e%3cuse transform='scale(0.707)' xlink:href='%23MJMATHI-54' x='2234' y='0'%3e%3c/use%3e%3cuse transform='scale(0.707)' xlink:href='%23MJMATHI-4E' x='2939' y='0'%3e%3c/use%3e%3cuse transform='scale(0.707)' xlink:href='%23MJMAIN-2B' x='3827' y='0'%3e%3c/use%3e%3cuse transform='scale(0.707)' xlink:href='%23MJMATHI-46' x='4606' y='0'%3e%3c/use%3e%3cuse transform='scale(0.707)' xlink:href='%23MJMATHI-50' x='5355' y='0'%3e%3c/use%3e%3cuse transform='scale(0.707)' xlink:href='%23MJMAIN-2B' x='6107' y='0'%3e%3c/use%3e%3cuse transform='scale(0.707)' xlink:href='%23MJMATHI-46' x='6885' y='0'%3e%3c/use%3e%3cuse transform='scale(0.707)' xlink:href='%23MJMATHI-4E' x='7635' y='0'%3e%3c/use%3e%3c/g%3e%3c/g%3e%3c/g%3e%3c/g%3e%3c/g%3e%3c/g%3e%3c/svg%3e)
Threshold Analysis
The Threshold Analysis section provides the advanced diagnostic tools needed to optimize your assay’s performance and justify your chosen cut-off points.
This section moves beyond static metrics to show you how your interpretation logic behaves across a spectrum of possible values, which is essential for both initial calibration and retrospective performance tuning.
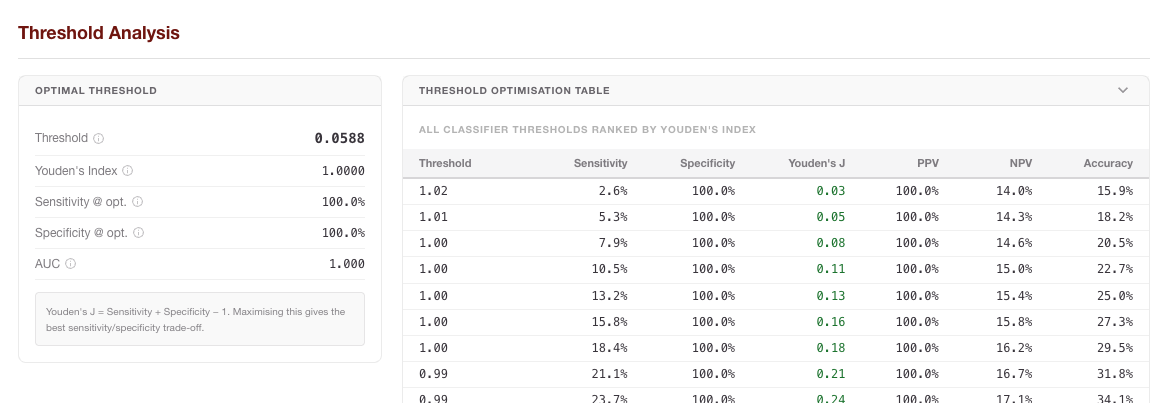
Based on the analysis modules, this section includes:
-
ROC (Receiver Operating Characteristic) Curves: A visual representation of the trade-off between Sensitivity and Specificity. The curve plots the True Positive Rate against the False Positive Rate at various threshold settings. The Area Under the Curve (AUC) is also calculated, providing a single global metric for the interpreter's ability to discriminate between positive and negative samples.
-
Threshold Optimization Table: A detailed breakdown showing how specific diagnostic metrics (Sensitivity, Specificity, PPV, NPV) would shift if you moved your threshold up or down. This allows you to select a cut-off that prioritizes the specific clinical needs of your assay (e.g., maximizing sensitivity for a screening test).
-
Youden’s Index
![]() : To assist in identifying the mathematically "optimal" threshold, RARE calculates Youden’s Index for every point on the ROC curve. This index represents the point where the sum of Sensitivity and Specificity is maximized.
: To assist in identifying the mathematically "optimal" threshold, RARE calculates Youden’s Index for every point on the ROC curve. This index represents the point where the sum of Sensitivity and Specificity is maximized.
![]()
'%3e%3cuse xlink:href='%23MJMATHI-4A' x='154' y='-50'%3e%3c/use%3e%3c/g%3e%3c/svg%3e)
'%3e%3cg transform='translate(167%2c0)'%3e%3cg transform='translate(-13%2c0)'%3e%3cg transform='translate(0%2c-48)'%3e%3cuse xlink:href='%23MJMATHI-4A' x='0' y='0'%3e%3c/use%3e%3cuse xlink:href='%23MJMAIN-3D' x='911' y='0'%3e%3c/use%3e%3cg transform='translate(1967%2c0)'%3e%3cuse xlink:href='%23MJMAIN-53'%3e%3c/use%3e%3cuse xlink:href='%23MJMAIN-65' x='556' y='0'%3e%3c/use%3e%3cuse xlink:href='%23MJMAIN-6E' x='1001' y='0'%3e%3c/use%3e%3cuse xlink:href='%23MJMAIN-73' x='1557' y='0'%3e%3c/use%3e%3cuse xlink:href='%23MJMAIN-69' x='1952' y='0'%3e%3c/use%3e%3cuse xlink:href='%23MJMAIN-74' x='2230' y='0'%3e%3c/use%3e%3cuse xlink:href='%23MJMAIN-69' x='2620' y='0'%3e%3c/use%3e%3cuse xlink:href='%23MJMAIN-76' x='2898' y='0'%3e%3c/use%3e%3cuse xlink:href='%23MJMAIN-69' x='3427' y='0'%3e%3c/use%3e%3cuse xlink:href='%23MJMAIN-74' x='3705' y='0'%3e%3c/use%3e%3cuse xlink:href='%23MJMAIN-79' x='4095' y='0'%3e%3c/use%3e%3c/g%3e%3cuse xlink:href='%23MJMAIN-2B' x='6813' y='0'%3e%3c/use%3e%3cg transform='translate(7814%2c0)'%3e%3cuse xlink:href='%23MJMAIN-53'%3e%3c/use%3e%3cuse xlink:href='%23MJMAIN-70' x='556' y='0'%3e%3c/use%3e%3cuse xlink:href='%23MJMAIN-65' x='1113' y='0'%3e%3c/use%3e%3cuse xlink:href='%23MJMAIN-63' x='1557' y='0'%3e%3c/use%3e%3cuse xlink:href='%23MJMAIN-69' x='2002' y='0'%3e%3c/use%3e%3cuse xlink:href='%23MJMAIN-66' x='2280' y='0'%3e%3c/use%3e%3cuse xlink:href='%23MJMAIN-69' x='2587' y='0'%3e%3c/use%3e%3cuse xlink:href='%23MJMAIN-63' x='2865' y='0'%3e%3c/use%3e%3cuse xlink:href='%23MJMAIN-69' x='3310' y='0'%3e%3c/use%3e%3cuse xlink:href='%23MJMAIN-74' x='3588' y='0'%3e%3c/use%3e%3cuse xlink:href='%23MJMAIN-79' x='3978' y='0'%3e%3c/use%3e%3c/g%3e%3cuse xlink:href='%23MJMAIN-2212' x='12542' y='0'%3e%3c/use%3e%3cuse xlink:href='%23MJMAIN-31' x='13543' y='0'%3e%3c/use%3e%3c/g%3e%3c/g%3e%3c/g%3e%3c/g%3e%3c/svg%3e)
In addition to the optimization table, the Decision Plot provides a powerful visual summary of your assay's performance across the entire threshold range. This dual-axis chart plots both Sensitivity and Specificity simultaneously against the threshold value.
The Decision Plot allows you to:
-
Identify the Crossover Point: Easily locate the "Equal Error Rate" where Sensitivity and Specificity intersect, representing a balanced performance profile.
-
Visualize Performance Trade-offs: See at a glance how rapidly Sensitivity drops or Specificity rises as you adjust your cut-off, helping you identify "stable" regions where minor variations in signal won't drastically impact clinical results.
-
Support Clinical Justification: By overlaying these two critical metrics, the plot provides a clear visual rationale for selecting a specific threshold—for example, choosing a point slightly to the left of the intersection to prioritize high Sensitivity for a screening application.
This graphical representation transforms the raw data of the optimization table into an intuitive tool for making informed, data-driven configuration decisions.
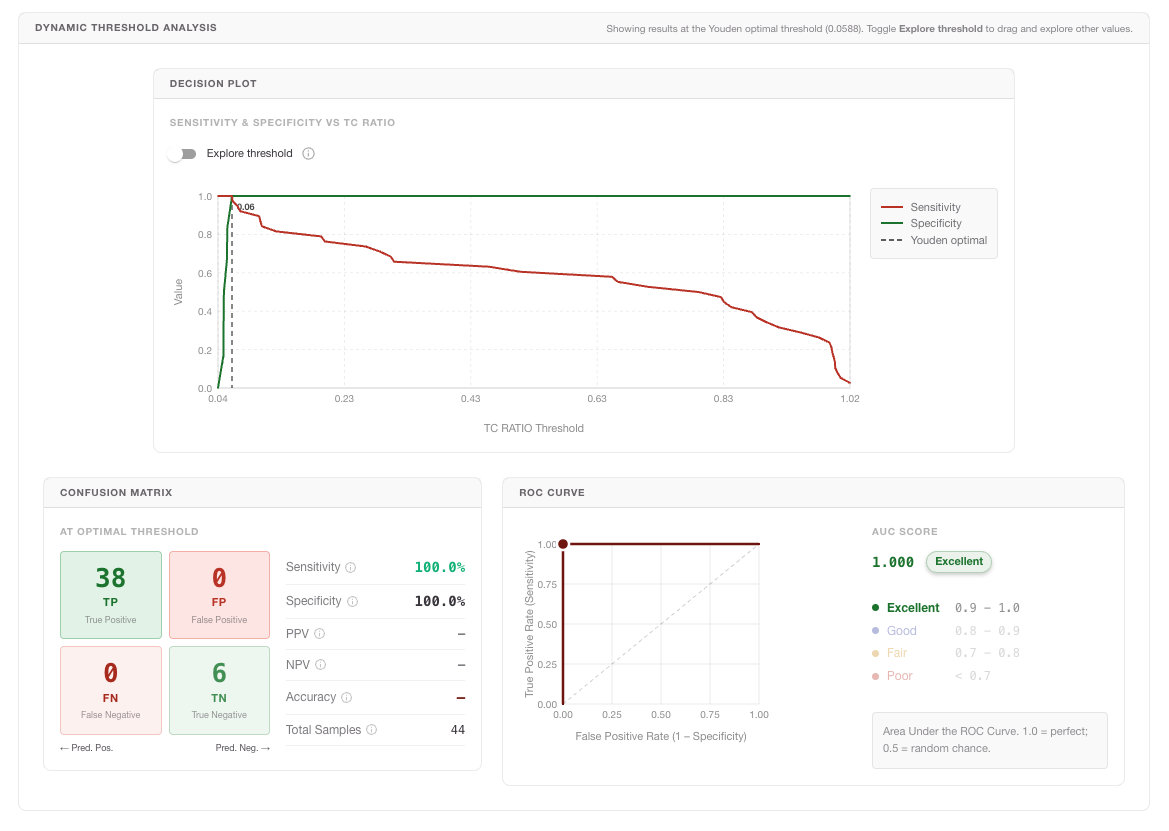
Toggle Explore threshold to drag and explore the impact of using other threshold values.
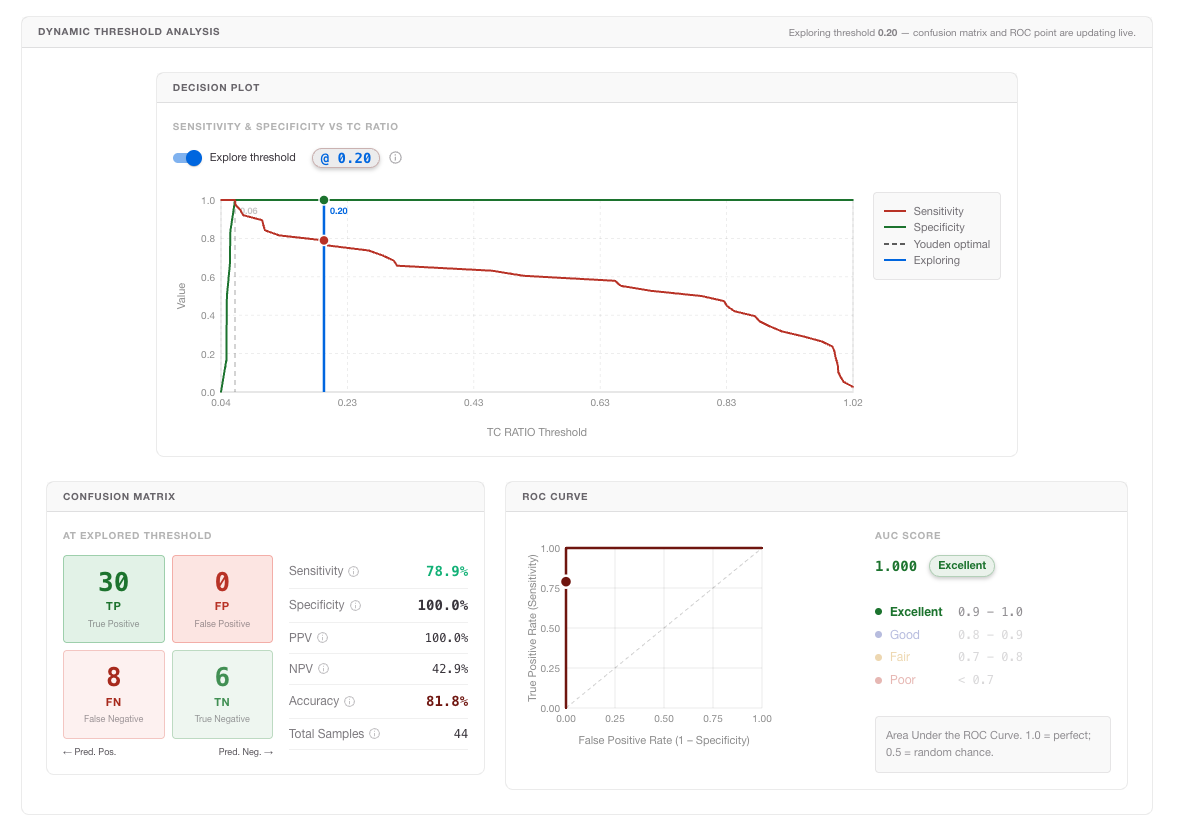
By using these tools, you can provide objective, data-driven justification for your classifier configurations, ensuring they are optimized for the best possible clinical outcome.
Analytical Performance
The Analytical Performance section focuses on the quantitative precision and reliability of your assay.
While diagnostic metrics evaluate clinical "Pass/Fail" accuracy, this section examines the underlying numerical data to ensure your interpreter is producing consistent, linear, and unbiased results across the entire reportable range.
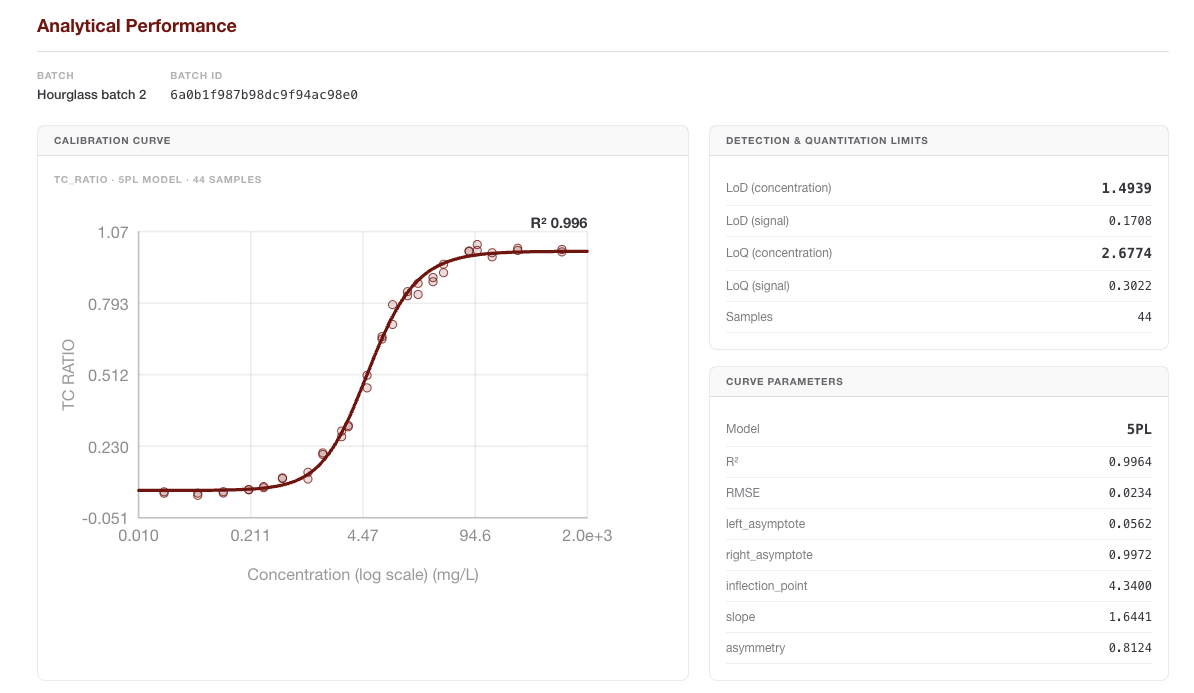
Based on the analysis modules, this section includes:
-
Linearity and Regression Analysis: This module compares the interpreter's quantitative output against the expected Ground Truth values. RARE generates a scatter plot with a Linear Regression line to visualize the relationship. Key statistics provided include the Slope, Intercept, and the Coefficient of Determination
![]() , which indicates how well the data fits the linear model, where
, which indicates how well the data fits the linear model, where
![]() and
and
![]()
-
Bias and Recovery: This analysis determines if the system consistently over- or under-estimates concentrations. RARE calculates the Percent Recovery for each sample, providing a clear view of systematic error across different concentration levels.
![]()
-
Precision (Repeatability): By analyzing replicates within your dataset, RARE evaluates the "closeness of agreement" between independent results. This is expressed as the Coefficient of Variation (%CV), a standardized measure of dispersion that allows you to assess the stability of your assay and interpreter across multiple runs.
![]()
where![]() is the standard deviation and
is the standard deviation and
![]() is the mean of the replicates.
is the mean of the replicates.
'%3e%3cg transform='translate(167%2c0)'%3e%3cg transform='translate(-13%2c0)'%3e%3cg transform='translate(0%2c-42)'%3e%3cuse xlink:href='%23MJMAIN-28' x='0' y='0'%3e%3c/use%3e%3cg transform='translate(389%2c0)'%3e%3cuse xlink:href='%23MJMATHI-52' x='0' y='0'%3e%3c/use%3e%3cuse transform='scale(0.707)' xlink:href='%23MJMAIN-32' x='1074' y='513'%3e%3c/use%3e%3c/g%3e%3cuse xlink:href='%23MJMAIN-29' x='1602' y='0'%3e%3c/use%3e%3c/g%3e%3c/g%3e%3c/g%3e%3c/g%3e%3c/svg%3e)
'%3e%3cg transform='translate(167%2c0)'%3e%3cg transform='translate(-13%2c0)'%3e%3cg transform='translate(0%2c-47)'%3e%3cuse xlink:href='%23MJMATHI-79' x='0' y='0'%3e%3c/use%3e%3cuse xlink:href='%23MJMAIN-3D' x='775' y='0'%3e%3c/use%3e%3cuse xlink:href='%23MJMATHI-6D' x='1831' y='0'%3e%3c/use%3e%3cuse xlink:href='%23MJMATHI-78' x='2710' y='0'%3e%3c/use%3e%3cuse xlink:href='%23MJMAIN-2B' x='3504' y='0'%3e%3c/use%3e%3cuse xlink:href='%23MJMATHI-63' x='4505' y='0'%3e%3c/use%3e%3c/g%3e%3c/g%3e%3c/g%3e%3c/g%3e%3c/svg%3e)
'%3e%3cg transform='translate(167%2c0)'%3e%3cg transform='translate(-13%2c0)'%3e%3cuse xlink:href='%23MJMATHI-52' x='0' y='0'%3e%3c/use%3e%3cuse transform='scale(0.707)' xlink:href='%23MJMAIN-32' x='1074' y='513'%3e%3c/use%3e%3cuse xlink:href='%23MJMAIN-3D' x='1491' y='0'%3e%3c/use%3e%3cuse xlink:href='%23MJMAIN-31' x='2547' y='0'%3e%3c/use%3e%3cuse xlink:href='%23MJMAIN-2212' x='3270' y='0'%3e%3c/use%3e%3cg transform='translate(4048%2c0)'%3e%3cg transform='translate(342%2c0)'%3e%3crect stroke='none' width='1774' height='60' x='0' y='220'%3e%3c/rect%3e%3cg transform='translate(60%2c531)'%3e%3cuse transform='scale(0.707)' xlink:href='%23MJMATHI-53' x='0' y='0'%3e%3c/use%3e%3cg transform='translate(456%2c0)'%3e%3cuse transform='scale(0.707)' xlink:href='%23MJMATHI-53' x='0' y='0'%3e%3c/use%3e%3cg transform='translate(433%2c-107)'%3e%3cuse transform='scale(0.5)' xlink:href='%23MJMATHI-72' x='0' y='0'%3e%3c/use%3e%3cuse transform='scale(0.5)' xlink:href='%23MJMATHI-65' x='451' y='0'%3e%3c/use%3e%3cuse transform='scale(0.5)' xlink:href='%23MJMATHI-73' x='918' y='0'%3e%3c/use%3e%3c/g%3e%3c/g%3e%3c/g%3e%3cg transform='translate(104%2c-419)'%3e%3cuse transform='scale(0.707)' xlink:href='%23MJMATHI-53' x='0' y='0'%3e%3c/use%3e%3cg transform='translate(456%2c0)'%3e%3cuse transform='scale(0.707)' xlink:href='%23MJMATHI-53' x='0' y='0'%3e%3c/use%3e%3cg transform='translate(433%2c-107)'%3e%3cuse transform='scale(0.5)' xlink:href='%23MJMATHI-74' x='0' y='0'%3e%3c/use%3e%3cuse transform='scale(0.5)' xlink:href='%23MJMATHI-6F' x='361' y='0'%3e%3c/use%3e%3cuse transform='scale(0.5)' xlink:href='%23MJMATHI-74' x='847' y='0'%3e%3c/use%3e%3c/g%3e%3c/g%3e%3c/g%3e%3c/g%3e%3c/g%3e%3c/g%3e%3c/g%3e%3c/g%3e%3c/svg%3e)
'%3e%3cg transform='translate(167%2c0)'%3e%3cg transform='translate(-13%2c0)'%3e%3cuse xlink:href='%23MJMAIN-25'%3e%3c/use%3e%3cuse xlink:href='%23MJMAIN-52' x='1083' y='0'%3e%3c/use%3e%3cuse xlink:href='%23MJMAIN-65' x='1820' y='0'%3e%3c/use%3e%3cuse xlink:href='%23MJMAIN-63' x='2264' y='0'%3e%3c/use%3e%3cuse xlink:href='%23MJMAIN-6F' x='2709' y='0'%3e%3c/use%3e%3cuse xlink:href='%23MJMAIN-76' x='3209' y='0'%3e%3c/use%3e%3cuse xlink:href='%23MJMAIN-65' x='3738' y='0'%3e%3c/use%3e%3cuse xlink:href='%23MJMAIN-72' x='4182' y='0'%3e%3c/use%3e%3cuse xlink:href='%23MJMAIN-79' x='4575' y='0'%3e%3c/use%3e%3cuse xlink:href='%23MJMAIN-3D' x='5381' y='0'%3e%3c/use%3e%3cg transform='translate(6437%2c0)'%3e%3cuse xlink:href='%23MJSZ2-28'%3e%3c/use%3e%3cg transform='translate(597%2c0)'%3e%3cg transform='translate(120%2c0)'%3e%3crect stroke='none' width='6627' height='60' x='0' y='220'%3e%3c/rect%3e%3cg transform='translate(806%2c435)'%3e%3cuse transform='scale(0.707)' xlink:href='%23MJMAIN-4D'%3e%3c/use%3e%3cuse transform='scale(0.707)' xlink:href='%23MJMAIN-65' x='917' y='0'%3e%3c/use%3e%3cuse transform='scale(0.707)' xlink:href='%23MJMAIN-61' x='1362' y='0'%3e%3c/use%3e%3cuse transform='scale(0.707)' xlink:href='%23MJMAIN-73' x='1862' y='0'%3e%3c/use%3e%3cuse transform='scale(0.707)' xlink:href='%23MJMAIN-75' x='2257' y='0'%3e%3c/use%3e%3cuse transform='scale(0.707)' xlink:href='%23MJMAIN-72' x='2813' y='0'%3e%3c/use%3e%3cuse transform='scale(0.707)' xlink:href='%23MJMAIN-65' x='3205' y='0'%3e%3c/use%3e%3cuse transform='scale(0.707)' xlink:href='%23MJMAIN-64' x='3650' y='0'%3e%3c/use%3e%3cuse transform='scale(0.707)' xlink:href='%23MJMAIN-56' x='4560' y='0'%3e%3c/use%3e%3cuse transform='scale(0.707)' xlink:href='%23MJMAIN-61' x='5311' y='0'%3e%3c/use%3e%3cuse transform='scale(0.707)' xlink:href='%23MJMAIN-6C' x='5811' y='0'%3e%3c/use%3e%3cuse transform='scale(0.707)' xlink:href='%23MJMAIN-75' x='6090' y='0'%3e%3c/use%3e%3cuse transform='scale(0.707)' xlink:href='%23MJMAIN-65' x='6646' y='0'%3e%3c/use%3e%3c/g%3e%3cg transform='translate(60%2c-419)'%3e%3cuse transform='scale(0.707)' xlink:href='%23MJMAIN-47'%3e%3c/use%3e%3cuse transform='scale(0.707)' xlink:href='%23MJMAIN-72' x='785' y='0'%3e%3c/use%3e%3cuse transform='scale(0.707)' xlink:href='%23MJMAIN-6F' x='1178' y='0'%3e%3c/use%3e%3cuse transform='scale(0.707)' xlink:href='%23MJMAIN-75' x='1678' y='0'%3e%3c/use%3e%3cuse transform='scale(0.707)' xlink:href='%23MJMAIN-6E' x='2235' y='0'%3e%3c/use%3e%3cuse transform='scale(0.707)' xlink:href='%23MJMAIN-64' x='2791' y='0'%3e%3c/use%3e%3cuse transform='scale(0.707)' xlink:href='%23MJMAIN-54' x='3701' y='0'%3e%3c/use%3e%3cuse transform='scale(0.707)' xlink:href='%23MJMAIN-72' x='4424' y='0'%3e%3c/use%3e%3cuse transform='scale(0.707)' xlink:href='%23MJMAIN-75' x='4816' y='0'%3e%3c/use%3e%3cuse transform='scale(0.707)' xlink:href='%23MJMAIN-74' x='5373' y='0'%3e%3c/use%3e%3cuse transform='scale(0.707)' xlink:href='%23MJMAIN-68' x='5762' y='0'%3e%3c/use%3e%3cuse transform='scale(0.707)' xlink:href='%23MJMAIN-56' x='6672' y='0'%3e%3c/use%3e%3cuse transform='scale(0.707)' xlink:href='%23MJMAIN-61' x='7423' y='0'%3e%3c/use%3e%3cuse transform='scale(0.707)' xlink:href='%23MJMAIN-6C' x='7923' y='0'%3e%3c/use%3e%3cuse transform='scale(0.707)' xlink:href='%23MJMAIN-75' x='8202' y='0'%3e%3c/use%3e%3cuse transform='scale(0.707)' xlink:href='%23MJMAIN-65' x='8758' y='0'%3e%3c/use%3e%3c/g%3e%3c/g%3e%3c/g%3e%3cuse xlink:href='%23MJSZ2-29' x='7465' y='-1'%3e%3c/use%3e%3c/g%3e%3cuse xlink:href='%23MJMAIN-D7' x='14722' y='0'%3e%3c/use%3e%3cg transform='translate(15723%2c0)'%3e%3cuse xlink:href='%23MJMAIN-31'%3e%3c/use%3e%3cuse xlink:href='%23MJMAIN-30' x='500' y='0'%3e%3c/use%3e%3cuse xlink:href='%23MJMAIN-30' x='1001' y='0'%3e%3c/use%3e%3c/g%3e%3c/g%3e%3c/g%3e%3c/g%3e%3c/svg%3e)
'%3e%3cg transform='translate(167%2c0)'%3e%3cg transform='translate(-13%2c0)'%3e%3cuse xlink:href='%23MJMAIN-25'%3e%3c/use%3e%3cuse xlink:href='%23MJMAIN-43' x='833' y='0'%3e%3c/use%3e%3cuse xlink:href='%23MJMAIN-56' x='1556' y='0'%3e%3c/use%3e%3cuse xlink:href='%23MJMAIN-3D' x='2584' y='0'%3e%3c/use%3e%3cg transform='translate(3640%2c0)'%3e%3cuse xlink:href='%23MJSZ2-28'%3e%3c/use%3e%3cg transform='translate(597%2c0)'%3e%3cg transform='translate(120%2c0)'%3e%3crect stroke='none' width='546' height='60' x='0' y='220'%3e%3c/rect%3e%3cuse transform='scale(0.707)' xlink:href='%23MJMATHI-3C3' x='100' y='605'%3e%3c/use%3e%3cuse transform='scale(0.707)' xlink:href='%23MJMATHI-3BC' x='84' y='-488'%3e%3c/use%3e%3c/g%3e%3c/g%3e%3cuse xlink:href='%23MJSZ2-29' x='1384' y='-1'%3e%3c/use%3e%3c/g%3e%3cuse xlink:href='%23MJMAIN-D7' x='5844' y='0'%3e%3c/use%3e%3cg transform='translate(6845%2c0)'%3e%3cuse xlink:href='%23MJMAIN-31'%3e%3c/use%3e%3cuse xlink:href='%23MJMAIN-30' x='500' y='0'%3e%3c/use%3e%3cuse xlink:href='%23MJMAIN-30' x='1001' y='0'%3e%3c/use%3e%3c/g%3e%3c/g%3e%3c/g%3e%3c/g%3e%3c/svg%3e)
'%3e%3cuse xlink:href='%23MJMATHI-3C3' x='154' y='-50'%3e%3c/use%3e%3c/g%3e%3c/svg%3e)
'%3e%3cuse xlink:href='%23MJMATHI-3BC' x='154' y='-42'%3e%3c/use%3e%3c/g%3e%3c/svg%3e)
Batch-to-Batch Variability
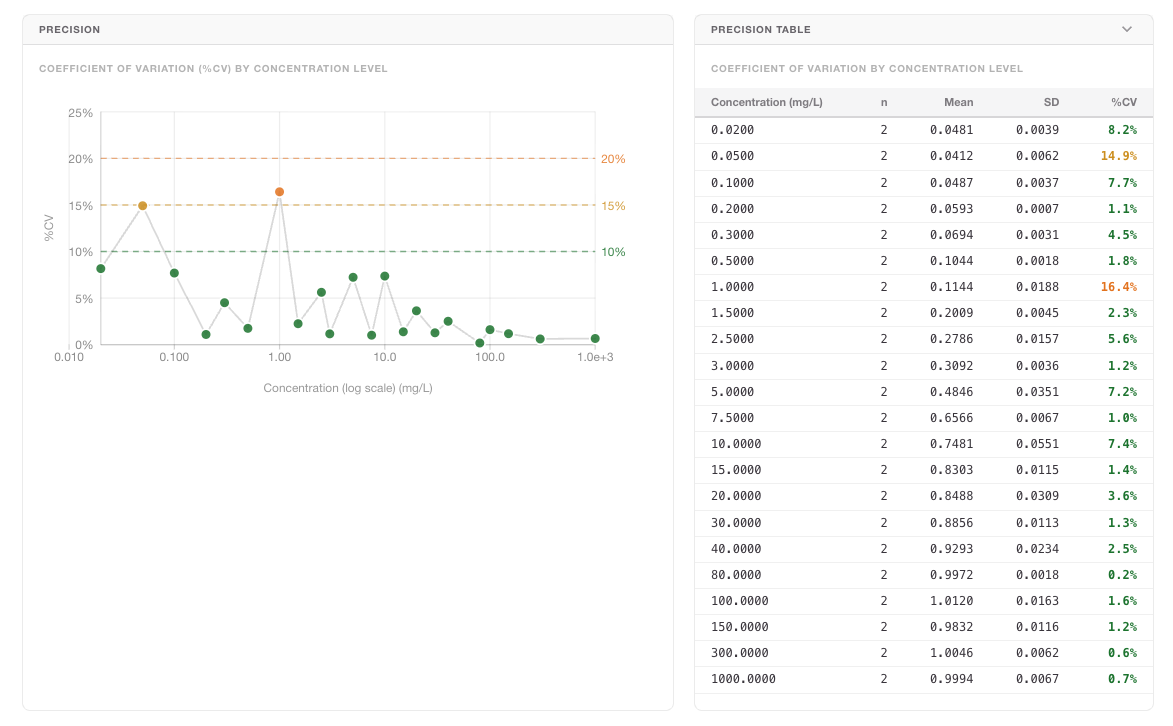
he Batch-to-Batch Variability section provides the critical evidence needed to demonstrate the robustness of your interpreter across different manufacturing lots. In lateral flow production, slight variations in materials or reagent deposition can impact signal intensity; this section helps you verify that your Batch Configurations are successfully normalizing these differences to provide consistent results.
Based on the analysis modules, this section includes:
-
Calibration Curve Overlay: This plot displays the mathematical fit for each batch configuration included in the report. By overlaying these curves, you can visually assess if different lots follow the same response trajectory or if there is a "shift" in signal intensity across the concentration range.
-
Parameter Comparison Table: RARE extracts the key coefficients from the underlying 4PL or 5PL models (such as Slope, EC50, and Asymptotes) and presents them side-by-side. This allows you to quantify exactly how the biochemical response varies between lots.
-
Residuals (Observed - Predicted) Box Plot: This diagnostic tool visualizes the distribution of error for each batch. It helps you identify if a specific lot has a higher degree of "noise" or a consistent bias compared to the others.
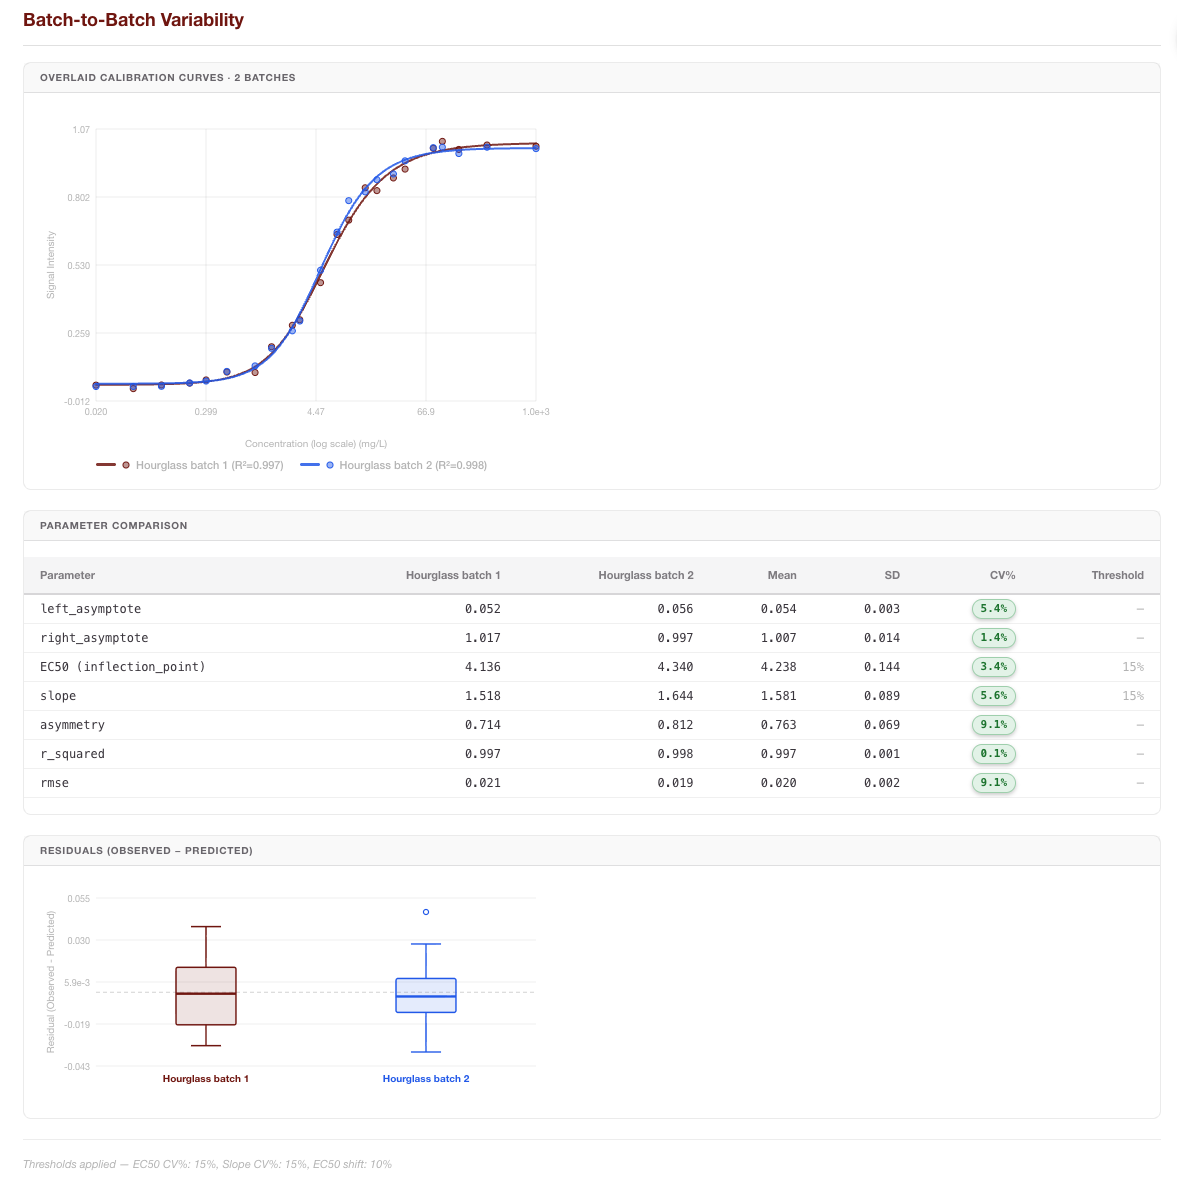
Understanding the Residuals Box Plot
The box plots in this section allow you to see at a glance how consistently each batch is performing. For each batch:
-
The Center Line (Median): Represents the median residual. If this line is at zero, the batch is perfectly centered on the Ground Truth. If it is consistently above or below zero, it indicates a systematic bias for that specific lot.
-
The Box (Interquartile Range - IQR): Represents the middle 50% of your data. A "taller" box indicates higher variability (lower precision) within that batch.
-
The Whiskers: Extend to show the spread of the rest of the data.
-
Outliers (Individual Dots): Any results that fall significantly outside the expected range are plotted as individual points, helping you identify specific samples that may have had physical defects or interpretation anomalies.
Batch Comparison Metrics
RARE calculates how each "Test" batch deviates from the designated Reference Batch using the following formulae:
Mean Residual (Bias):
The average difference between the measured values and the Ground Truth for the batch.
'%3e%3cg transform='translate(167%2c0)'%3e%3cg transform='translate(-13%2c0)'%3e%3cg transform='translate(0%2c-146)'%3e%3cuse xlink:href='%23MJMAIN-4D'%3e%3c/use%3e%3cuse xlink:href='%23MJMAIN-65' x='917' y='0'%3e%3c/use%3e%3cuse xlink:href='%23MJMAIN-61' x='1362' y='0'%3e%3c/use%3e%3cuse xlink:href='%23MJMAIN-6E' x='1862' y='0'%3e%3c/use%3e%3cuse xlink:href='%23MJMAIN-52' x='2669' y='0'%3e%3c/use%3e%3cuse xlink:href='%23MJMAIN-65' x='3405' y='0'%3e%3c/use%3e%3cuse xlink:href='%23MJMAIN-73' x='3850' y='0'%3e%3c/use%3e%3cuse xlink:href='%23MJMAIN-69' x='4244' y='0'%3e%3c/use%3e%3cuse xlink:href='%23MJMAIN-64' x='4523' y='0'%3e%3c/use%3e%3cuse xlink:href='%23MJMAIN-75' x='5079' y='0'%3e%3c/use%3e%3cuse xlink:href='%23MJMAIN-61' x='5636' y='0'%3e%3c/use%3e%3cuse xlink:href='%23MJMAIN-6C' x='6136' y='0'%3e%3c/use%3e%3cuse xlink:href='%23MJMAIN-3D' x='6692' y='0'%3e%3c/use%3e%3cg transform='translate(7471%2c0)'%3e%3cg transform='translate(397%2c0)'%3e%3crect stroke='none' width='13600' height='60' x='0' y='220'%3e%3c/rect%3e%3cg transform='translate(60%2c737)'%3e%3cuse xlink:href='%23MJSZ1-2211' x='0' y='0'%3e%3c/use%3e%3cuse xlink:href='%23MJMAIN-28' x='1056' y='0'%3e%3c/use%3e%3cg transform='translate(1446%2c0)'%3e%3cuse xlink:href='%23MJMAIN-4D'%3e%3c/use%3e%3cuse xlink:href='%23MJMAIN-65' x='917' y='0'%3e%3c/use%3e%3cuse xlink:href='%23MJMAIN-61' x='1362' y='0'%3e%3c/use%3e%3cuse xlink:href='%23MJMAIN-73' x='1862' y='0'%3e%3c/use%3e%3cuse xlink:href='%23MJMAIN-75' x='2257' y='0'%3e%3c/use%3e%3cuse xlink:href='%23MJMAIN-72' x='2813' y='0'%3e%3c/use%3e%3cuse xlink:href='%23MJMAIN-65' x='3206' y='0'%3e%3c/use%3e%3cuse xlink:href='%23MJMAIN-64' x='3650' y='0'%3e%3c/use%3e%3c/g%3e%3cuse xlink:href='%23MJMAIN-2212' x='5875' y='0'%3e%3c/use%3e%3cg transform='translate(6875%2c0)'%3e%3cuse xlink:href='%23MJMAIN-47'%3e%3c/use%3e%3cuse xlink:href='%23MJMAIN-72' x='785' y='0'%3e%3c/use%3e%3cuse xlink:href='%23MJMAIN-6F' x='1178' y='0'%3e%3c/use%3e%3cuse xlink:href='%23MJMAIN-75' x='1678' y='0'%3e%3c/use%3e%3cuse xlink:href='%23MJMAIN-6E' x='2235' y='0'%3e%3c/use%3e%3cuse xlink:href='%23MJMAIN-64' x='2791' y='0'%3e%3c/use%3e%3cuse xlink:href='%23MJMAIN-54' x='3598' y='0'%3e%3c/use%3e%3cuse xlink:href='%23MJMAIN-72' x='4320' y='0'%3e%3c/use%3e%3cuse xlink:href='%23MJMAIN-75' x='4713' y='0'%3e%3c/use%3e%3cuse xlink:href='%23MJMAIN-74' x='5269' y='0'%3e%3c/use%3e%3cuse xlink:href='%23MJMAIN-68' x='5659' y='0'%3e%3c/use%3e%3c/g%3e%3cuse xlink:href='%23MJMAIN-29' x='13091' y='0'%3e%3c/use%3e%3c/g%3e%3cuse xlink:href='%23MJMATHI-6E' x='6500' y='-686'%3e%3c/use%3e%3c/g%3e%3c/g%3e%3c/g%3e%3c/g%3e%3c/g%3e%3c/g%3e%3c/svg%3e)
Batch-Specific Coefficient of Variation (%CV):
This metric quantifies the precision of the residuals for a specific batch, allowing you to compare the "tightness" of results against your reference lot.
'%3e%3cg transform='translate(167%2c0)'%3e%3cg transform='translate(-13%2c0)'%3e%3cuse xlink:href='%23MJMAIN-25'%3e%3c/use%3e%3cuse xlink:href='%23MJMAIN-43' x='833' y='0'%3e%3c/use%3e%3cuse xlink:href='%23MJMAIN-56' x='1556' y='0'%3e%3c/use%3e%3cg transform='translate(2306%2c0)'%3e%3cuse xlink:href='%23MJMATHI-62' x='0' y='0'%3e%3c/use%3e%3cuse xlink:href='%23MJMATHI-61' x='429' y='0'%3e%3c/use%3e%3cuse xlink:href='%23MJMATHI-74' x='959' y='0'%3e%3c/use%3e%3cuse xlink:href='%23MJMATHI-63' x='1320' y='0'%3e%3c/use%3e%3cuse xlink:href='%23MJMATHI-68' x='1754' y='0'%3e%3c/use%3e%3c/g%3e%3cuse xlink:href='%23MJMAIN-3D' x='4914' y='0'%3e%3c/use%3e%3cg transform='translate(5971%2c0)'%3e%3cuse xlink:href='%23MJSZ3-28'%3e%3c/use%3e%3cg transform='translate(736%2c0)'%3e%3cg transform='translate(120%2c0)'%3e%3crect stroke='none' width='2981' height='60' x='0' y='220'%3e%3c/rect%3e%3cg transform='translate(60%2c676)'%3e%3cuse xlink:href='%23MJMATHI-53' x='0' y='0'%3e%3c/use%3e%3cuse xlink:href='%23MJMATHI-44' x='645' y='0'%3e%3c/use%3e%3cg transform='translate(1474%2c0)'%3e%3cuse xlink:href='%23MJMATHI-72' x='0' y='0'%3e%3c/use%3e%3cuse xlink:href='%23MJMATHI-65' x='451' y='0'%3e%3c/use%3e%3cuse xlink:href='%23MJMATHI-73' x='918' y='0'%3e%3c/use%3e%3c/g%3e%3c/g%3e%3cg transform='translate(315%2c-686)'%3e%3cuse xlink:href='%23MJMATHI-3BC' x='0' y='0'%3e%3c/use%3e%3cg transform='translate(603%2c-150)'%3e%3cuse transform='scale(0.707)' xlink:href='%23MJMATHI-62' x='0' y='0'%3e%3c/use%3e%3cuse transform='scale(0.707)' xlink:href='%23MJMATHI-61' x='429' y='0'%3e%3c/use%3e%3cuse transform='scale(0.707)' xlink:href='%23MJMATHI-74' x='959' y='0'%3e%3c/use%3e%3cuse transform='scale(0.707)' xlink:href='%23MJMATHI-63' x='1320' y='0'%3e%3c/use%3e%3cuse transform='scale(0.707)' xlink:href='%23MJMATHI-68' x='1754' y='0'%3e%3c/use%3e%3c/g%3e%3c/g%3e%3c/g%3e%3c/g%3e%3cuse xlink:href='%23MJSZ3-29' x='3958' y='-1'%3e%3c/use%3e%3c/g%3e%3cuse xlink:href='%23MJMAIN-D7' x='10887' y='0'%3e%3c/use%3e%3cg transform='translate(11888%2c0)'%3e%3cuse xlink:href='%23MJMAIN-31'%3e%3c/use%3e%3cuse xlink:href='%23MJMAIN-30' x='500' y='0'%3e%3c/use%3e%3cuse xlink:href='%23MJMAIN-30' x='1001' y='0'%3e%3c/use%3e%3c/g%3e%3c/g%3e%3c/g%3e%3c/g%3e%3c/svg%3e)
By analyzing these plots and tables, you can objectively determine if a new manufacturing lot is performing within your established QC tolerances or if it requires a unique calibration update.
View / Edit an existing Performance Report Configuration
From the Report Configuration you can
-
View Reports: Opens the detailed report view to examine metrics, charts, and result breakdowns.
-
In order to make changes you need to save as a new version
-
Generate Report: Re-runs the analysis using the same parameters to ensure consistency or update the view.
After you’ve done this
Once a report is generated:
-
Review Metrics: Navigate to the "View Report" screen to see qualitative diagnostic metrics and ROC curves.
-
Verify Lineage: Check the report metadata to ensure the correct versions of configurations were used.
-
Data Safety: RARE never modifies your original dataset results during report generation; it creates a snapshot of the performance at that moment in time.