
|
Novarum DX Ltd
|
Document ID: IFU031
|
This page explains what a Method is in the RARE platform and how to manage Methods in the RARE Portal, including viewing the Method list, creating new Methods, and viewing or editing existing Methods.
What is a Method?
A Method defines how the RARE platform should capture, process, and interpret images for a specific test on a given Housing. It brings together:
-
The physical test format – via the selected Housing
-
The camera and optics setup – via Camera Optics
-
The reader behaviour – via Reader Configuration and Reader Parameters
-
The strip‑level regions and corrections – via Configure Strips
In practice, a Method tells the RARE system:
-
Which Housing and Camera Optics to use when capturing images
-
How the reader should behave during capture (e.g. Flash, Data collection mode, number of Frames to capture)
-
Which parts of each strip to analyse:
-
The ROI (corners) for each strip
-
The profile regions where Control and Test lines are expected
-
-
How to apply control‑based corrections:
-
Whether to use Control Exposure, Control line correction and Control baseline
-
How far to extend or trim the control region
-
How to search for the control line (e.g. Div profile, Step search, Search Min/Max, Minimum Fit percentage, Search Method)
-
How to model and correct the baseline (e.g. Polynomial baseline order, Initial H Scale factor, Control baseline threshold)
-
Together, these settings determine how raw images from the camera are turned into stable, reliable line profiles that can then be interpreted as qualitative or quantitative results.
Methods are created and maintained by paid users using the Create Method workflow and are then used downstream alongside Batches, Classifiers, and Ground Truth data to generate diagnostic outputs.
Method Management
Accessing
-
Log in to the RARE Portal as a paid user.
-
In the left-hand sidebar, go to Configurations → Methods (or Method Management, depending on your build).
-
The Method Management page opens, showing a list of all existing Methods that have been configured for your environment.
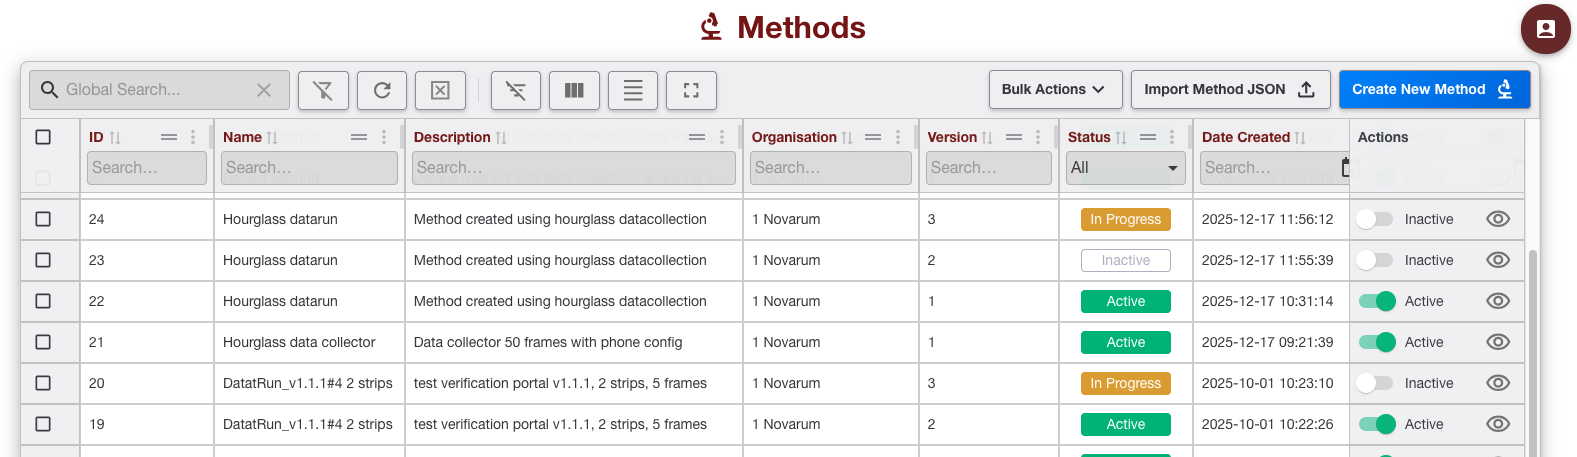
Understanding the Method Management list
The Method Management list gives you a table of all previously saved Methods.
Each row represents a single Method configuration. By default, the list typically includes columns such as:
-
ID – System-generated unique identifier for the Method.
-
Method Name – Human-readable name (e.g. “CRP Quantitative v2”).
-
Description – Short description (e.g. target analyte, assay type, customer, or use case).
-
Organisation - Associated organisation name who owns the Method
-
Version - the version of the Method, tracking edits
-
Status – Whether the Method is currently Active, Inactive, In Progress, or For Datarun.
-
Date Created – When this Method configuration was first created.
-
Date Updated – When it was last changed.
-
Actions – Menu or buttons to view, edit, enable/disable, or create a Method.
Use this list to quickly see:
-
Which Methods are available for use
-
Which Housing each Method is built on
-
Whether a Method is active or has been disabled
-
When each Method was last updated
Filtering and sorting Methods

To help you find the right Method quickly, you can:
Filter
At the top of the table, use the filters to narrow down the list, for example by:
-
Method Name or ID – Start typing to match specific Methods.
-
Organisation – Filter Methods linked to a particular Organisation.
-
Status – Show only Enabled or Disabled Methods.
-
Date range – Limit to Methods created or updated within a specific period.
Tip: Filters can reduce the visible list to zero rows if set too tightly. If you see no results, clear or relax one or more filters.
Sort
Click on a column header (such as Updated date, Name, or Housing) to sort the list in ascending or descending order. This is useful to:
-
Bring the most recently updated Methods to the top
-
Group Methods alphabetically by name
-
Group Enabled / Disabled Methods together
Actions available for each Method
Each row has an Actions menu (e.g. a “…” menu or a button group). Depending on your implementation, this typically includes:
-
Edit / View – Open the Method in edit mode (see “Viewing and Editing an Existing Method” below).
-
Enable / Disable Method – Toggle whether this Method can be used with Batches / products.
-
Create New Method – This is available from the list header.
Use these actions to manage your catalogue of Methods without leaving the main list view.
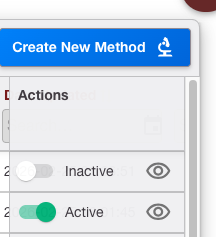
Creating a New Method
You can create a new Method from the Method Management list.
-
From the Method Management page, click Create New Method.
-
The Create Method workflow opens with the following steps:
-
Describe Method
-
Housing & Camera Optics
-
Configure Reader
-
Load Test Image
-
Configure Strips
-
Save
-
Step 1 – Describe Method
On the first screen you define the basic identity of the Method.

-
Method Name (required)
-
What it is: The primary name shown in the Methods list and anywhere this Method is referenced.
-
Guidance:
-
Include analyte, qualitative/quantitative, and version where relevant.
-
Examples:
-
CRP Quantitative (mg/L) -
COVID‑19 Ag Qualitative.
-
-
-
-
Method Description
-
What it is: A short explanation of what this Method is for.
-
Guidance:
-
Mention the assay type, sample type, and intended use.
-
Example:
Semi‑quantitative CRP assay for serum samples, 5–200 mg/L.
-
-
Step 2 – Housing & Camera Optics
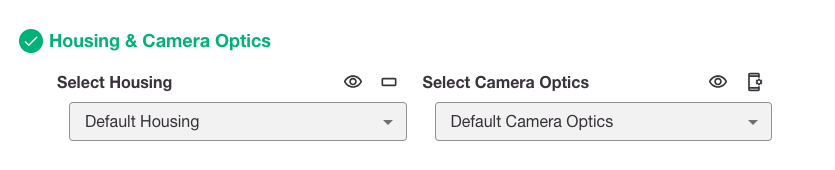
In this step you link the Method to its physical Housing and define which camera optics configuration will be used.
-
Select Housing (required)
-
What it is: The Housing that defines the physical layout (strips, windows, lines) for this Method.
-
Behaviour:
-
Only Housings that have been created (and typically Enabled) in Housings configuration will appear.
-
-
Guidance:
-
Choose the Housing that matches the actual test device used for this Method.
-
If you don’t see the expected Housing, check the Housings page.
-
-
-
Select Camera Optics (required)
-
What it is: The camera/optics configuration used when capturing images for this Method (for example device-specific lens/lighting settings).
-
Guidance:
-
Select the optics profile that matches the device or camera system your users will run this Method on.
-
Use the same optics setting that was used during development/validation.
-
-
Step 3 – Configure Reader
This step defines how the reader collects image data and applies global processing before looking at individual strips.
Reader Configuration - Data collection mode ON
Enables additional data capture (e.g. saving extra frames or debug data) when the Method runs.

Reader Parameters are minimal, controlling the flash and number of frames only. Default values are shown where applicable.
|
Field |
What it is |
Guidance |
|---|---|---|
|
Flash (ON/OFF) |
Controls whether the camera flash/illumination is used during capture. |
|
|
Frames to capture (default = 50) |
The number of image frames captured during a read. |
|
Reader Configuration - Data collection mode (OFF)
Disables additional data capture when the Method runs, for routine production use to minimise data volume while representing the operation of a production app.
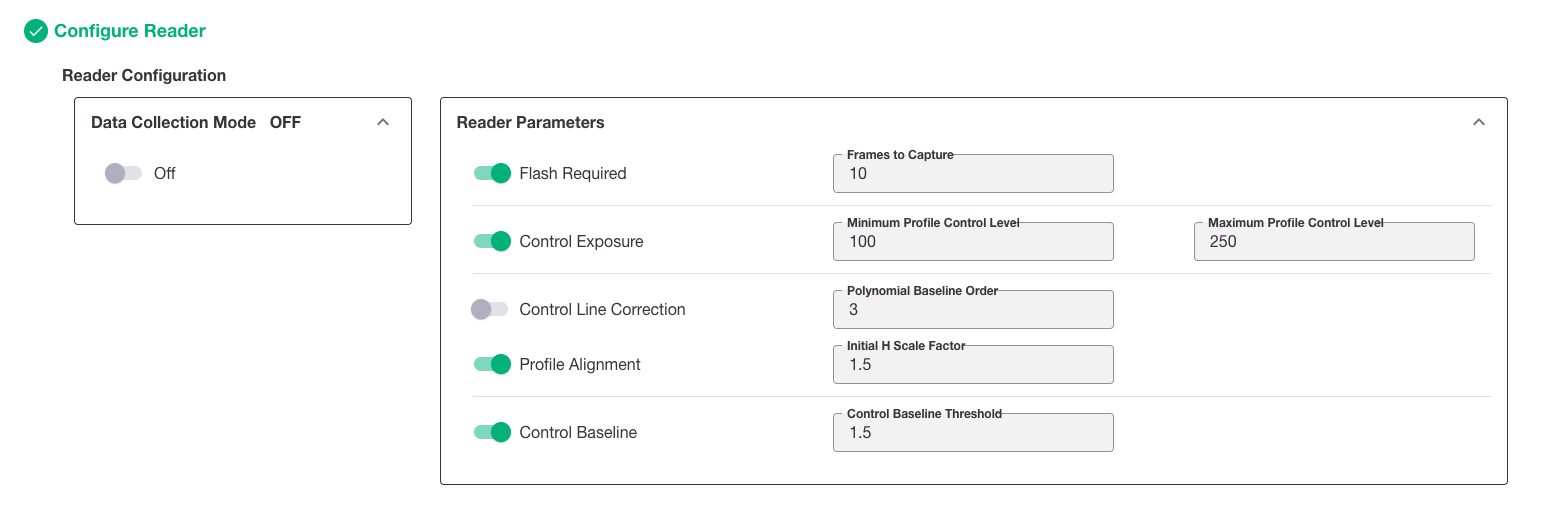
Reader Parameters control the behaviour of the camera and the initial signal processing. Default values are shown where applicable.
|
Field |
What it is |
Guidance |
|---|---|---|
|
Flash (ON/OFF) |
Controls whether the camera flash/illumination is used during capture. |
|
|
Frames to capture (default = 10) |
The number of image frames captured during a read. |
|
|
Control Exposure (ON/OFF) |
Whether the system automatically adjusts exposure based on the control line or region. |
|
|
Control line correction (ON/OFF) |
Enables corrections that use the control line signal (for example, to normalise or adjust for variation). |
|
|
Profile alignment (ON/OFF) |
Aligns intensity profiles along the strip to a standard position before analysis. |
|
|
Control baseline (ON/OFF) |
Enables calculation of a baseline around the control region for subsequent corrections. |
|
|
Minimum Profile control level (default = 100) |
Lower intensity bound for acceptable control line profile values. |
If the control line intensity falls below this level, the run may be considered invalid or flagged. |
|
Maximum Profile control level (default = 250) |
Upper intensity bound for acceptable control line profile values. |
Values above this may be treated as saturated or out of range. |
|
Polynomial baseline order (default = 3) |
The order of the polynomial used to model and subtract the baseline of the intensity profile. |
A value of 3 is a typical compromise; higher orders can fit noise, lower orders may not capture curvature. Change only if this was deliberately tuned as part of method development. |
|
Initial H Scale factor (default = 1.5) |
Initial horizontal scaling factor used when building or aligning profiles across the strip. |
Leave at 1.5 unless you have a documented reason to adjust it for a specific Housing or optics profile. |
|
Control baseline threshold (default = 1) |
Threshold used when applying control-based baseline correction. |
Helps determine when baseline adjustment should be applied or limited. |
Step 4 - Load Test Image
In this step you load a representative test image that will be used to define the strip regions and line positions in the next step.
This image is only used during Method setup.
It provides a visual reference so you can accurately mark the ROI (region of interest) and the profile regions for Control and Test lines.
Choosing a suitable image
When selecting an image to use in this step:
-
The image must have been captured using:
-
The same Housing you selected in Step 2, and
-
The same Camera Optics configuration you selected in Step 2.
-
-
The assay on the strip should be fully developed, with:
-
A clearly visible Control line, and
-
All Test line(s) you intend to configure present and visible.
-
-
The strip should be positioned in the image in a typical, well‑aligned way (not at an extreme angle or off‑centre).
Using a clear, representative image ensures that the regions you define in Step 5 will match how the strip usually appears in real‑world use.
Select image
-
On the Load Test Image step, click Select Image.
-
Select an existing result derived from the selected Housing
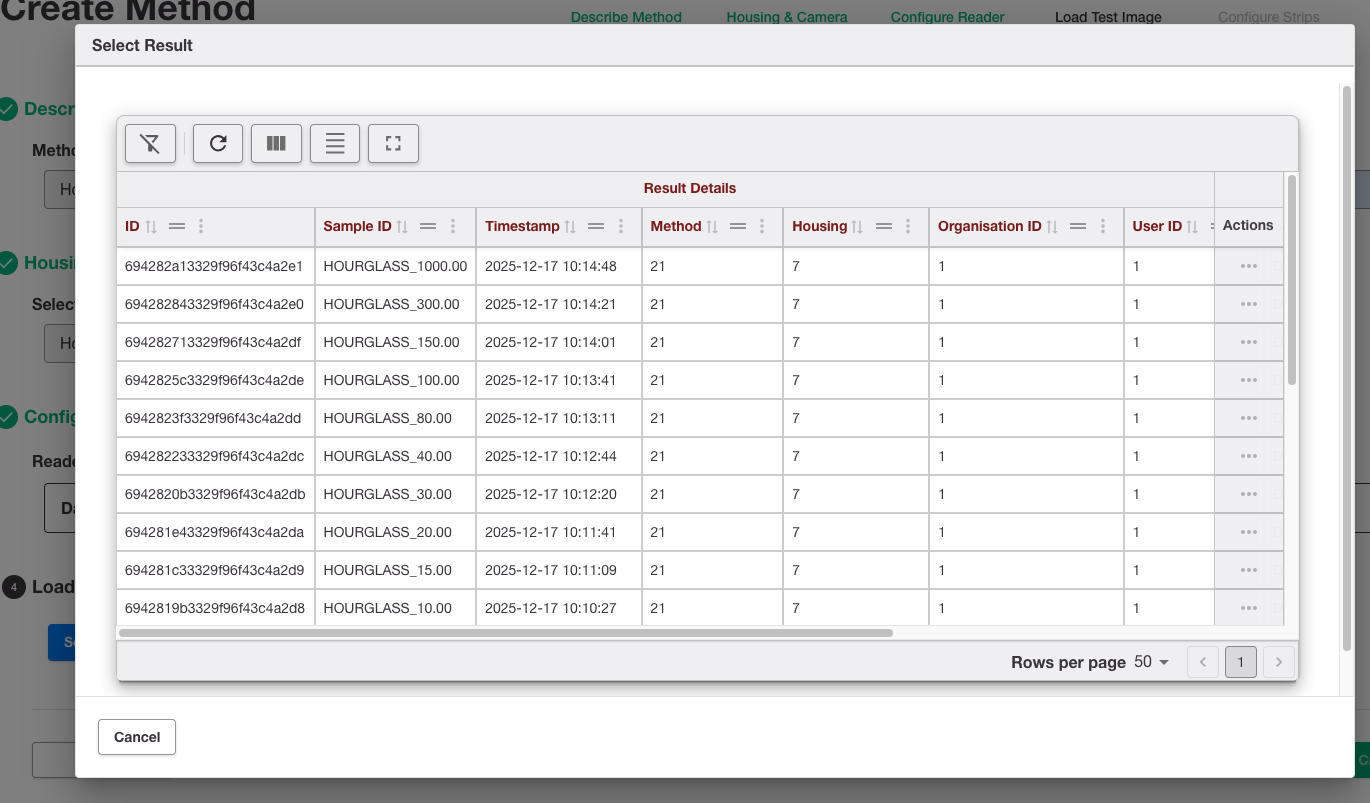
Select existing result
-
Select an image from the available list/gallery of frames from the result.
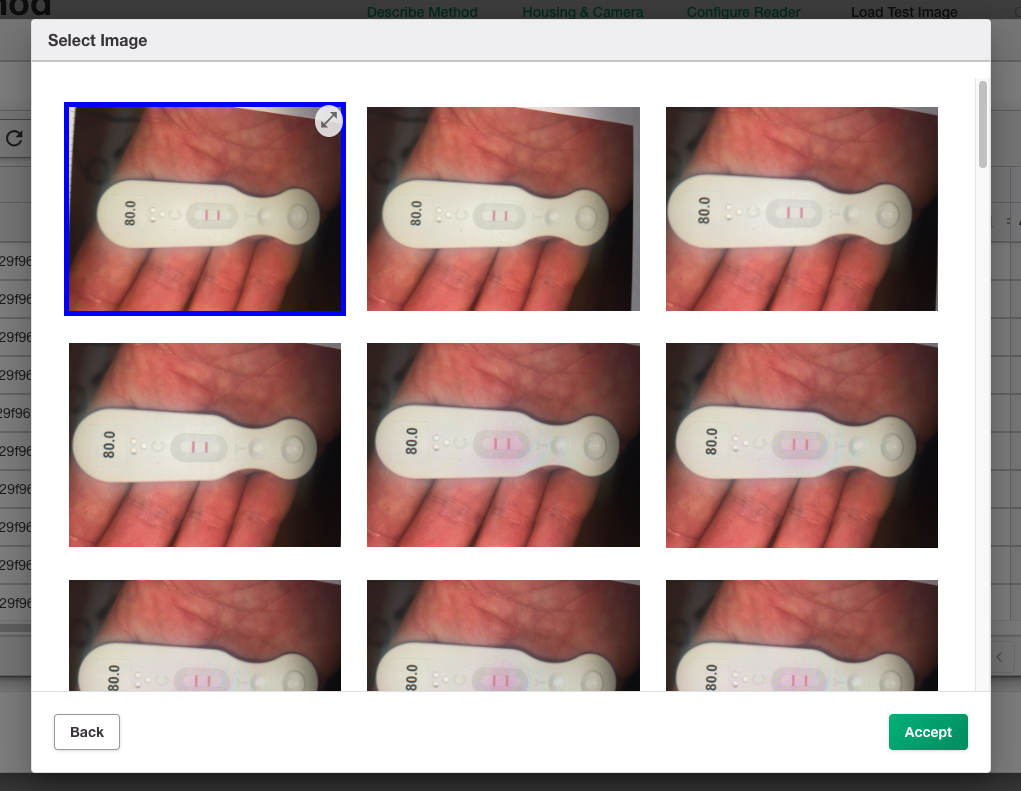
Image picker / gallery and an example selected image
-
Confirm your selection to load the image, ready to configure strip ROIs and line positions.
Step 5 – Configure Strips
Here you define the regions of interest on each strip and how the control line correction should behave.
If the selected Housing contains multiple strips, you will configure each strip in turn. For each strip:
Select corners (for ROI)
In this part you are telling the system where the strip sits in the image.
-
Look at the loaded test image and, for the current strip, click on three of its four corners.
-
As soon as you have clicked three corners, the system will automatically calculate the fourth corner representing a rectangle around the strip.
-
This bounding rectangle is the Region of Interest (ROI). Everything inside it will be used when the strip is analysed; everything outside is ignored.
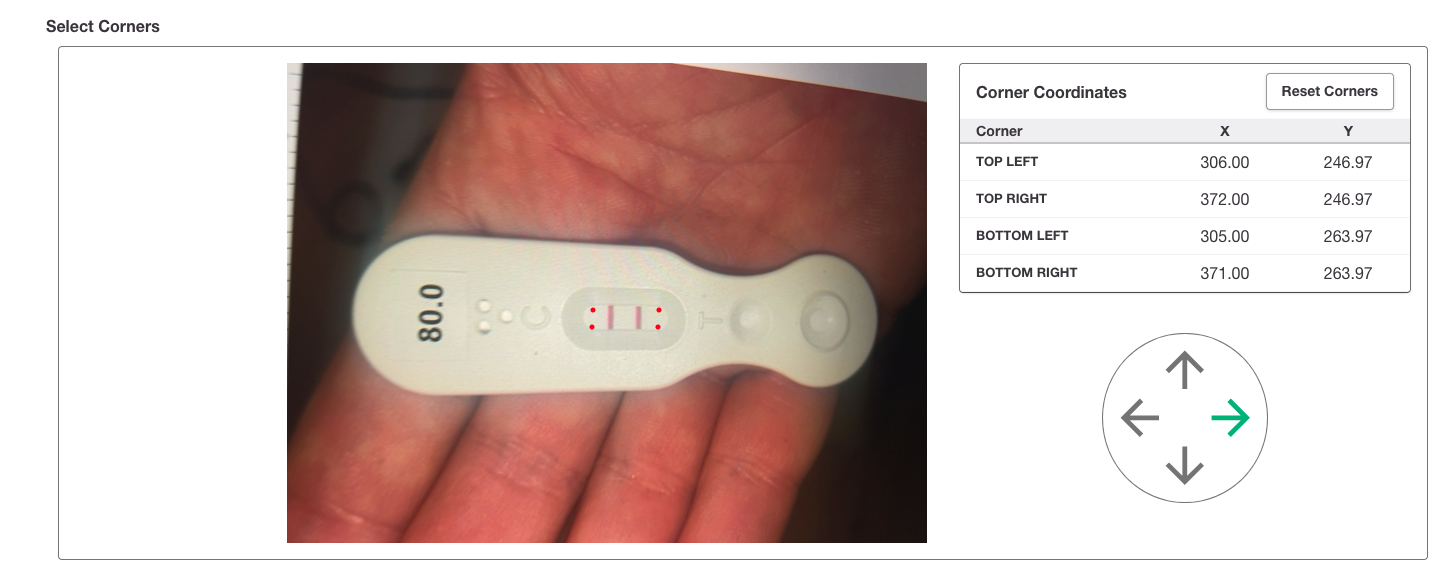
You can also control which way along the strip the profile is taken (for example, left‑to‑right or bottom‑to‑top) using the on‑screen directional arrows. Set this so that the profile direction follows the normal flow of the assay (from sample pad towards the distal end).
Aim for the ROI to comfortably cover the full length and width of the strip, including all lines, without too much empty background.
Set profile regions
Once the strip’s rectangle and direction are set, the system generates an intensity profile along the strip and displays it beneath or alongside the image. This profile is a graph showing how signal intensity changes along the length of the strip.
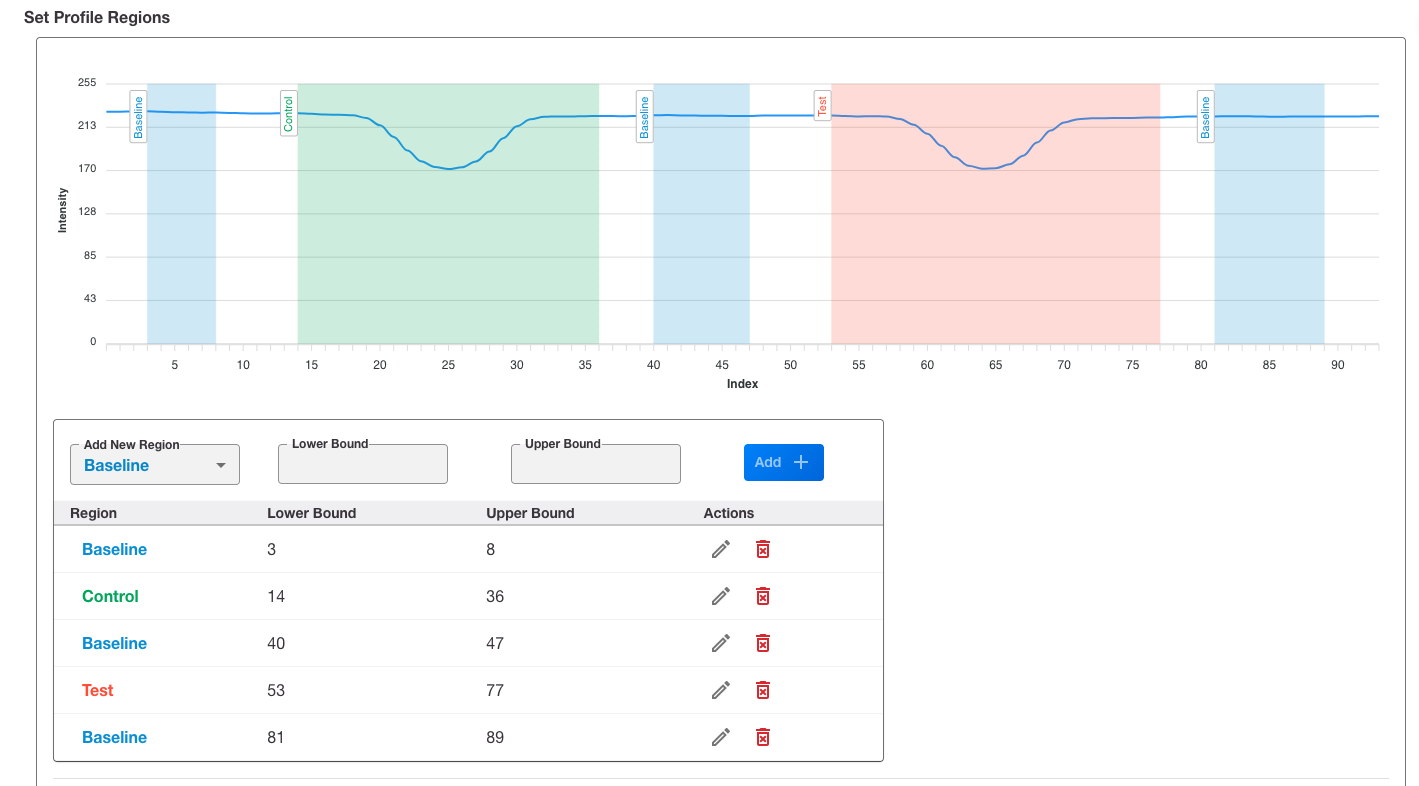
The next step is to tell the system where on that profile the lines and baseline live:
-
Position the line regions
Use the on‑screen tools to place the profile regions over the parts of the profile where the Control and Test lines appear.
-
Each region should sit over a visible peak in the intensity profile that corresponds to a real line on the strip.
-
For example, place one region over the Control line peak, and one (or more) over the Test line peak(s).
These regions tell the reader: “look here for the Control line” and “look here for the Test line(s)”.
-
-
Set the baseline regions
Next, define the baseline regions — parts of the profile where no lines are expected and the signal should represent background.
-
Place these regions in flat sections of the profile, away from any peaks.
-
The baseline is used to measure background intensity so that line signals can be corrected or normalised against it.
-
-
Visually check alignment
-
Confirm that each Control/Test region lines up both with:
-
The lines in the image, and
-
The corresponding peaks in the intensity profile.
-
-
Confirm that each baseline region sits over background areas (flat profile segments where no lines are present).
-
If your test image has all lines clearly visible (as recommended in Step 4), the profile regions should sit neatly over the peaks for each line, with baseline regions in the “flat” parts between or around them.
The regions can be set by clicking on the profile or by directly editing the table
Control Line corrections
These parameters fine‑tune how the system uses the control line region to correct or interpret signals.
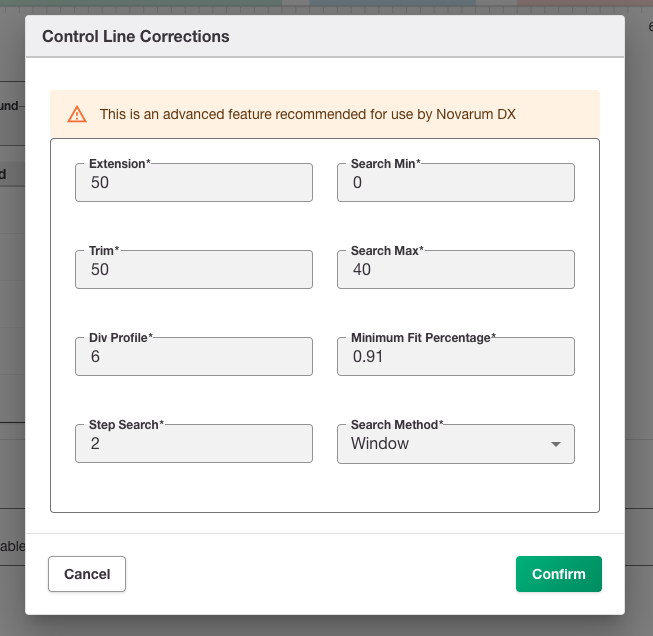
|
Parameter |
What it is |
Effect |
|---|---|---|
|
Extension (pixels or units, default = 50) |
How far beyond the control line region the system extends when building the control profile. |
Larger values include more surrounding background; smaller values focus more tightly on the line. |
|
Trim (pixels or units, default = 50) |
How much of the outer parts of the profile are removed (trimmed) before analysis. |
Helps remove noisy edges that are not informative for the control line. |
|
Div profile (default = 6) |
The number of profile segments or divisions used when analysing the control profile. |
Higher values give more fine‑grained analysis; lower values are coarser. |
|
Step search (default = 3) |
Step size used when searching within the profile for the best control line position or match. |
Smaller steps can be more precise but slower; larger steps are faster but less precise. |
|
Search Min (default = 0) |
Lower bound of the search range (in whatever units your profile uses, e.g. pixels or index). |
Typically set to where the control line region starts or just before. |
|
Search Max (default = 45) |
Upper bound of the search range. |
Typically set to where the control line region ends or just after. |
|
Minimum Fit percentage (default = 0.91) |
Minimum match/fit quality required (as a fraction or percentage) for a detected feature to be accepted as the control line. |
Higher values are stricter (reduce false positives but may reject weak/atypical lines). |
|
Search Method (default = window) |
The algorithm used when searching the profile (e.g. |
Use |
Repeat the configuration for each strip defined by the selected Housing.
Step 6 – Save
The final step lets you review your configuration and save the Method.
Review
-
Check the summary of:
-
Method Name and Description
-
Selected Housing and Camera Optics
-
Reader Configuration and Reader Parameters
-
Strip configurations and control‑line correction settings
-
Save options
-
Click Save (or Create Method) to create the Method.
-
The new Method will appear in the Method Management list. Its status/availability will follow whatever default behaviour your system uses for newly created Methods (for example, Enabled or Disabled by default).
Best practice: After creating a new Method, run a small set of test scans to confirm that strip location, control line correction, and exposure settings behave as expected before using it routinely
When to change defaults (and when not to)
Most of the parameters in Configure Reader and Configure Strips are low‑level image‑processing controls.
In general:
-
If you are setting up a new Method based on an existing, validated one, start from the same values and only change:
-
Method Name
-
Method Description
-
Housing / Camera Optics (if the physical device or capture device differs)
-
-
Only adjust items like Frames to capture, Polynomial baseline order, Minimum Fit percentage, Search Max, etc. if:
-
You are actively tuning performance with test data, and
-
You have agreement within your dev/validation team on the new setting.
-
If you are unsure about a parameter:
-
Prefer the default value shown in the UI.
-
Capture a note (e.g. in your validation log or change log) whenever you deliberately diverge from the defaults.
Viewing and Editing an Existing Method
Open an existing Method
-
From the Method Management list, locate the Method you want to update.
-
In the Actions column, choose View.
-
The Method Detail page opens, showing (for example):
-
Method Name and Description
-
Method ID
-
Linked Housing
-
Result type / mode and any classifier configuration
-
Configured measurement regions / lines
-
Current Status (Enabled / Disabled)
-
Created and Last updated information
-
Making changes
-
Update any of the editable fields, for example:
-
Refining the Description to better describe the assay
-
Adjusting the interpretation rules (e.g. cut-offs, thresholds, or mapping logic)
-
Changing region configuration if the Method should use different lines or windows on the Housing
-
-
If permitted, toggle the Status between Enabled and Disabled.
-
When finished, click Save Changes and a new version will be created.
You are returned to the Method Management list, and the Updated date reflects your latest changes.
Note: Changes to a Method can affect any Batches, validation, or downstream reporting that rely on it. Align edits with your validation and change-control process.
Enabling or Disabling a Method
As a paid user, you can control whether a Method can be used in active workflows.
-
From the Method Management list, locate the Method.
-
In the Actions menu, choose Enable Method or Disable Method.
-
Confirm the change if a confirmation dialog appears.
Typical behaviour:
-
Enabled Methods can be selected when configuring Batches / products and used during testing.
-
Disabled Methods remain in the list (for traceability) but are not available for new Batch configurations or active use.
Permissions and visibility
-
Paid users
-
Can access Method Management from the sidebar.
-
Can create, view, edit, enable, disable, and (where available) duplicate Methods.
-
-
Non-paid or restricted users
-
May not see Method Management in the sidebar, depending on your configuration.
-
Interact with Methods indirectly via configured Batches, tests, and results.
-
This ensures that any authorised paid user can configure and maintain Methods, while access for other users can be limited to running tests and viewing results.