
|
Novarum DX Ltd
|
Document ID: IFU037
|
Use this feature to configure, review, and manage quantitative batch calibration for your lateral flow assay, ensuring accurate and traceable result interpretation.
What is Quantitative Batch Configuration?
This page explains how to set up and manage quantitative batch configurations in RARE. You’ll learn how to describe your batch, select a dataset, perform calibration fitting, and review fit quality and acceptance criteria.
Quantitative batch configuration helps you:
-
Define and document each batch for traceability and audit.
-
Select the right dataset for calibration.
-
Fit calibration models, check bias, and validate fit quality.
-
Enable, disable, or update batch configurations as your assay evolves
Quantitative Batch Management
Accessing Quantitative Batch Configuration
-
Go to the RARE web portal → Batches → Select your batch
-
You need Editor or Admin access to configure batches. Viewers can review but not edit.
Understanding the Quantitative Batch List
-
The table displays all results in your selected Dataset, grouped by Strip and Test Line.
-
Each row represents a unique combination of batch ID, batch name, description, LOT, and date.
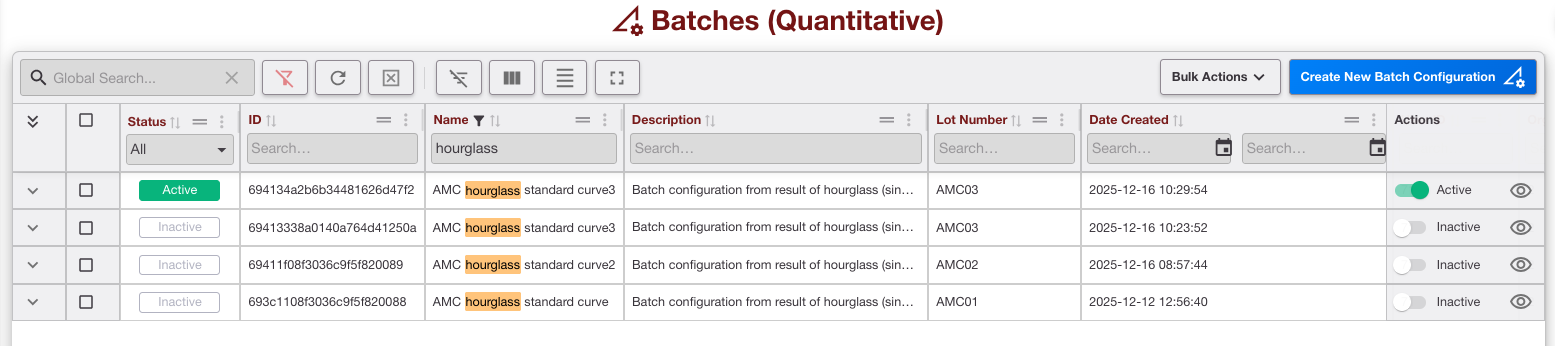
Filtering and Sorting Batches
Filter
-
Use filters to focus on specific strips, test lines, or sample groups.
-
Filtering helps you quickly locate samples needing concentration assignment or review.
Sort
-
Sort by sample ID, name, LOT, or date to organise your data for easier entry and review.
Actions Available
-
Enable/Disable: Toggle whether a batch is available for result interpretation.
Creating a New Quantitative Batch
Step 1 – Describe Batch
-
Enter a clear, descriptive name for your batch.
-
Add a batch code, LOT number, and manufacturer for traceability.
-
Optionally, add notes or a description for future reference.
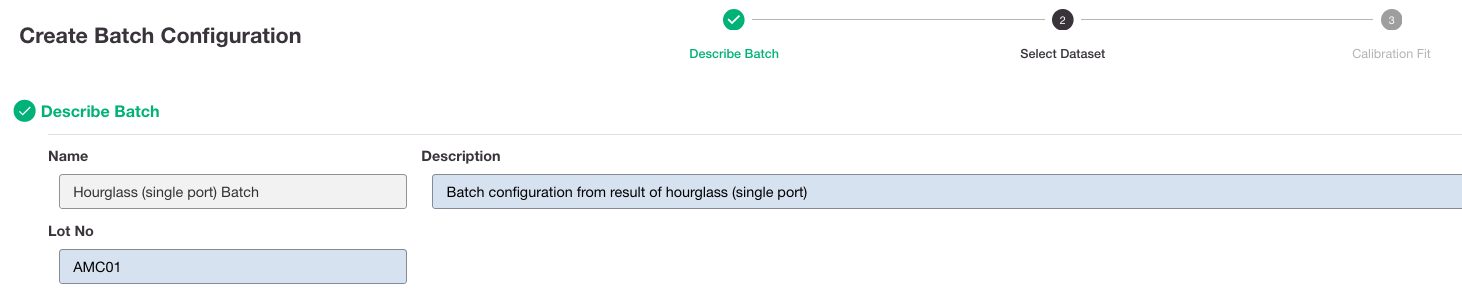
Use clear, consistent naming for batches and datasets.
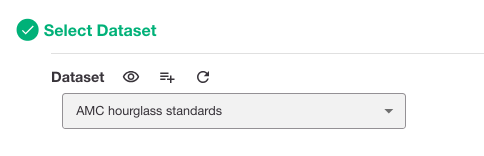
Step 2 – Select Dataset
-
Choose the dataset containing the results you want to use for calibration.
-
The dataset should include all relevant samples for this batch.
-
Review the dataset summary to ensure it matches your intended calibration set.
Step 3 – Calibration Fit
i) Enter Known Concentrations
-
Choose the signal type for the y-axis (e.g., intensity, T/C ratio).
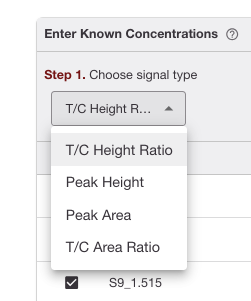
Choose signal type -
For each sample (row), enter the known concentration for the x-axis.
-
If ground truth is already assigned, these values may be pre-filled.
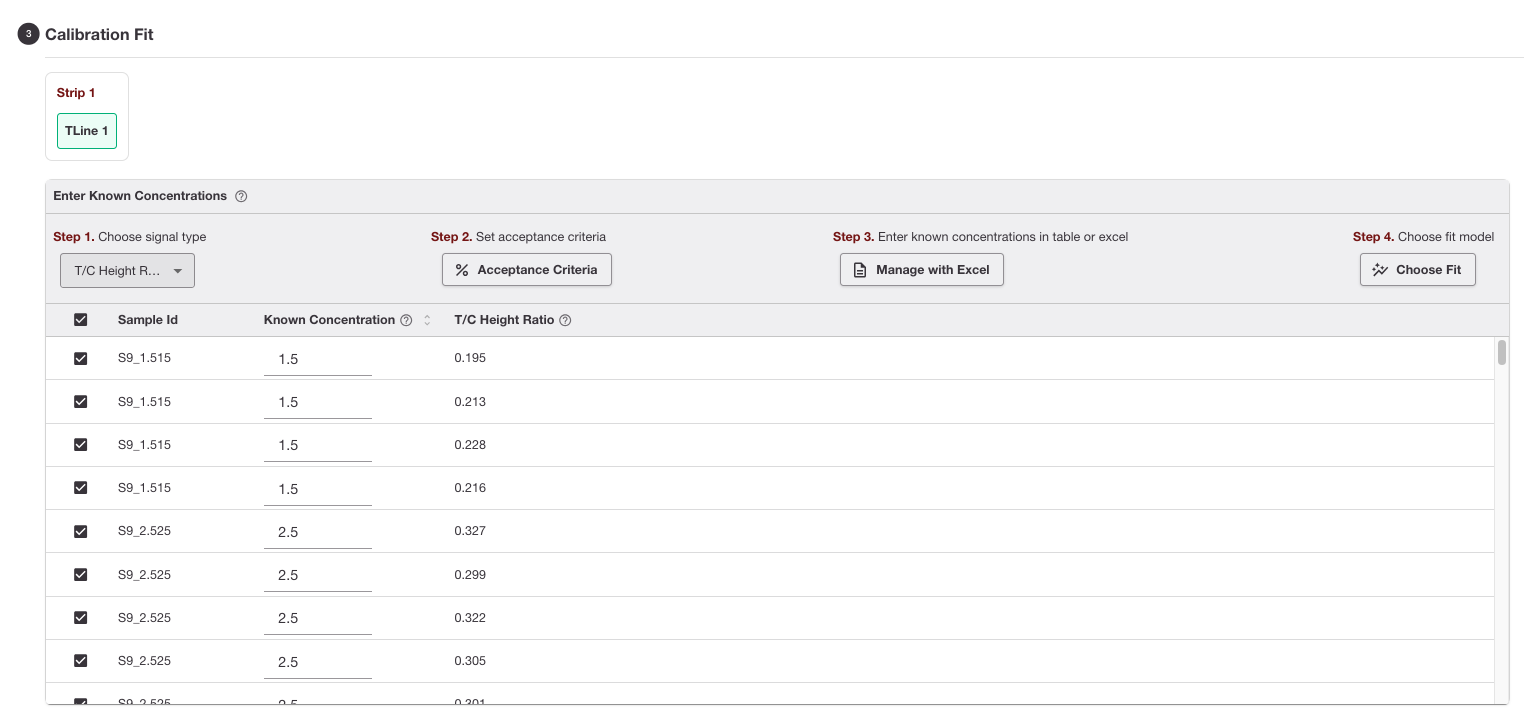
Samples from dataset with ground truth assigned -
You can also edit the table cell directly, or import concentrations from Excel if not already set.
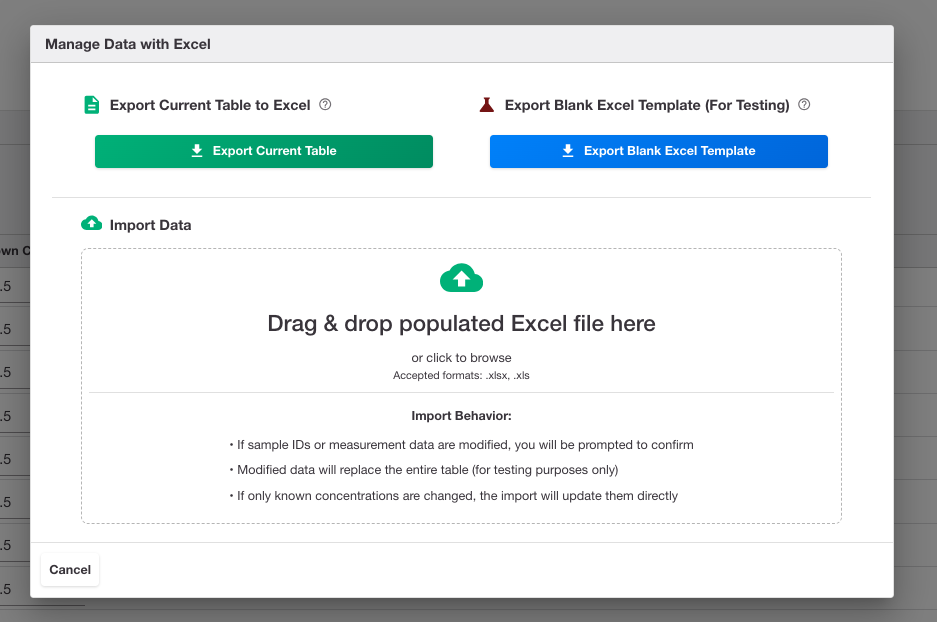
Enter known concentrations in table or excel
-
-
At least 4 known concentrations are required before fitting.
-
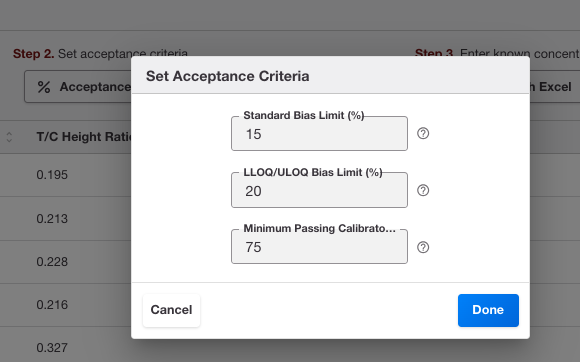
Acceptance criteria (bias limits, minimum passing calibrators) are shown and can be adjusted.
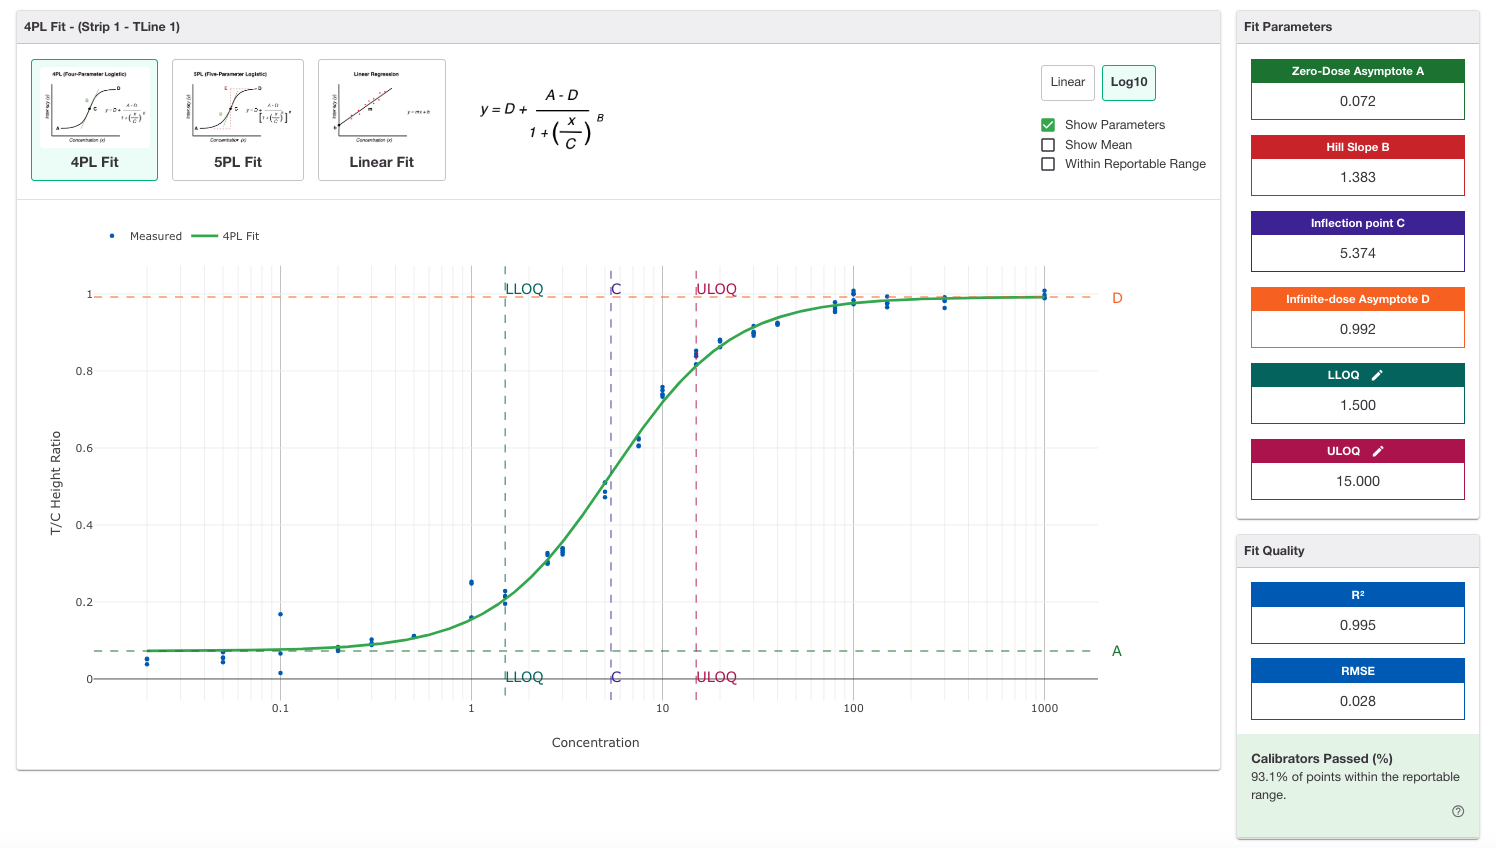
ii) Choose Fit Model
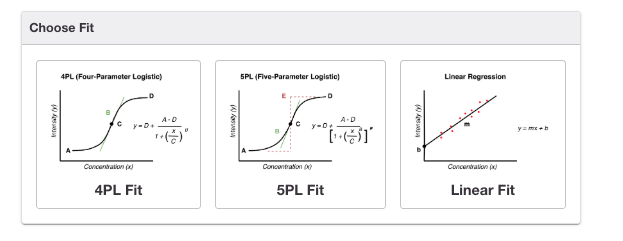
-
Select a calibration model that best represents your data (e.g., linear, 4-parameter logistic, etc.).
-
The system fits the model and displays:
-
Fit Parameters: (e.g., slope, intercept, asymptotes, inflection point)
-
Fit Quality: R², RMSE, and visual plots
-
Acceptance Criteria: Bias at each calibrator, % within limits, LLOQ/ULOQ
-
-
If the fit does not meet criteria, you can adjust concentrations, change the model, or review outliers.
After You’ve Done This
-
Review fit summary, plots, and acceptance criteria.
-
If satisfied, enable the batch for use in result interpretation.
-
Export fit reports for documentation or regulatory submission.
-
All changes are versioned; previous configurations remain accessible for audit.
Document any changes to concentrations or model selection for traceability.
Acceptance Criteria for Calibration Curve Validation
Quantitative batch calibration in RARE follows internationally recognized guidelines for bioanalytical method validation.
How Acceptance Criteria Are Applied
-
Curve Fitting
-
Fit your calibration data using linear, 4PL, or 5PL least-squares models.
-
The system records all fitted parameters, standard errors, and convergence status for review.
-
-
Back-Calculation of Calibrators
-
For each calibrator, the system uses the fitted model to invert the measured signal intensity back to concentration.
-
-
% Bias Calculation
-
For each calibrator:
![]()
-
-
Precision Assessment (if replicates exist)
-
For each calibrator level with replicates:
![]()
-
-
Acceptance Criteria
-
At least 75% of non-zero calibrators must have % bias within ±15% (default), except for LLOQ and ULOQ, which must be within ±20% (default).
-
These limits are user-editable.
-
Only calibrators within the reportable range (LLOQ to ULOQ, inclusive) are evaluated for acceptance.
-
The system clearly indicates Pass/Fail status for the calibration curve.
-
-
Reportable Range (LLOQ/ULOQ)
-
LLOQ (Lower Limit of Quantitation): The lowest calibrator meeting both bias and precision criteria (typically ≤20%).
-
ULOQ (Upper Limit of Quantitation): The highest calibrator meeting both bias and precision criteria (typically ≤20%).
-
Calibrators outside this range are reported as <LLOQ or >ULOQ.
-
-
Unknown Sample Quantitation
-
Once the curve is accepted, the same inversion process is used to back-calculate concentrations for unknown/test samples.
-
Results outside the reportable range are flagged as below or above quantitation limits.
-
-
Outputs and Data Presentation
The data table includes:-
Back-calculated concentration
-
% Bias for each calibrator
-
CV% (if replicates are present)
-
LLOQ and ULOQ identification
-
% of non-zero calibrators within bias limits
-
Overall Pass/Fail status
-
'%3e%3cg transform='translate(167%2c0)'%3e%3cg transform='translate(-13%2c0)'%3e%3cg transform='translate(0%2c-87)'%3e%3cuse xlink:href='%23MJMAIN-25' x='0' y='0'%3e%3c/use%3e%3cg transform='translate(833%2c0)'%3e%3cuse xlink:href='%23MJMAIN-42'%3e%3c/use%3e%3cuse xlink:href='%23MJMAIN-69' x='708' y='0'%3e%3c/use%3e%3cuse xlink:href='%23MJMAIN-61' x='987' y='0'%3e%3c/use%3e%3cuse xlink:href='%23MJMAIN-73' x='1487' y='0'%3e%3c/use%3e%3c/g%3e%3cuse xlink:href='%23MJMAIN-3D' x='2993' y='0'%3e%3c/use%3e%3cg transform='translate(3771%2c0)'%3e%3cg transform='translate(120%2c0)'%3e%3crect stroke='none' width='24359' height='60' x='0' y='220'%3e%3c/rect%3e%3cg transform='translate(60%2c676)'%3e%3cuse xlink:href='%23MJMAIN-42'%3e%3c/use%3e%3cuse xlink:href='%23MJMAIN-61' x='708' y='0'%3e%3c/use%3e%3cuse xlink:href='%23MJMAIN-63' x='1209' y='0'%3e%3c/use%3e%3cuse xlink:href='%23MJMAIN-6B' x='1653' y='0'%3e%3c/use%3e%3cuse xlink:href='%23MJMAIN-2D' x='2182' y='0'%3e%3c/use%3e%3cuse xlink:href='%23MJMAIN-63' x='2515' y='0'%3e%3c/use%3e%3cuse xlink:href='%23MJMAIN-61' x='2960' y='0'%3e%3c/use%3e%3cuse xlink:href='%23MJMAIN-6C' x='3460' y='0'%3e%3c/use%3e%3cuse xlink:href='%23MJMAIN-63' x='3739' y='0'%3e%3c/use%3e%3cuse xlink:href='%23MJMAIN-75' x='4183' y='0'%3e%3c/use%3e%3cuse xlink:href='%23MJMAIN-6C' x='4740' y='0'%3e%3c/use%3e%3cuse xlink:href='%23MJMAIN-61' x='5018' y='0'%3e%3c/use%3e%3cuse xlink:href='%23MJMAIN-74' x='5519' y='0'%3e%3c/use%3e%3cuse xlink:href='%23MJMAIN-65' x='5908' y='0'%3e%3c/use%3e%3cuse xlink:href='%23MJMAIN-64' x='6353' y='0'%3e%3c/use%3e%3cuse xlink:href='%23MJMAIN-63' x='7159' y='0'%3e%3c/use%3e%3cuse xlink:href='%23MJMAIN-6F' x='7604' y='0'%3e%3c/use%3e%3cuse xlink:href='%23MJMAIN-6E' x='8104' y='0'%3e%3c/use%3e%3cuse xlink:href='%23MJMAIN-63' x='8661' y='0'%3e%3c/use%3e%3cuse xlink:href='%23MJMAIN-65' x='9105' y='0'%3e%3c/use%3e%3cuse xlink:href='%23MJMAIN-6E' x='9550' y='0'%3e%3c/use%3e%3cuse xlink:href='%23MJMAIN-74' x='10106' y='0'%3e%3c/use%3e%3cuse xlink:href='%23MJMAIN-72' x='10496' y='0'%3e%3c/use%3e%3cuse xlink:href='%23MJMAIN-61' x='10888' y='0'%3e%3c/use%3e%3cuse xlink:href='%23MJMAIN-74' x='11389' y='0'%3e%3c/use%3e%3cuse xlink:href='%23MJMAIN-69' x='11778' y='0'%3e%3c/use%3e%3cuse xlink:href='%23MJMAIN-6F' x='12057' y='0'%3e%3c/use%3e%3cuse xlink:href='%23MJMAIN-6E' x='12557' y='0'%3e%3c/use%3e%3cuse xlink:href='%23MJMAIN-2212' x='13336' y='0'%3e%3c/use%3e%3cg transform='translate(14336%2c0)'%3e%3cuse xlink:href='%23MJMAIN-4E'%3e%3c/use%3e%3cuse xlink:href='%23MJMAIN-6F' x='750' y='0'%3e%3c/use%3e%3cuse xlink:href='%23MJMAIN-6D' x='1251' y='0'%3e%3c/use%3e%3cuse xlink:href='%23MJMAIN-69' x='2084' y='0'%3e%3c/use%3e%3cuse xlink:href='%23MJMAIN-6E' x='2363' y='0'%3e%3c/use%3e%3cuse xlink:href='%23MJMAIN-61' x='2919' y='0'%3e%3c/use%3e%3cuse xlink:href='%23MJMAIN-6C' x='3420' y='0'%3e%3c/use%3e%3cuse xlink:href='%23MJMAIN-63' x='3948' y='0'%3e%3c/use%3e%3cuse xlink:href='%23MJMAIN-6F' x='4393' y='0'%3e%3c/use%3e%3cuse xlink:href='%23MJMAIN-6E' x='4893' y='0'%3e%3c/use%3e%3cuse xlink:href='%23MJMAIN-63' x='5450' y='0'%3e%3c/use%3e%3cuse xlink:href='%23MJMAIN-65' x='5894' y='0'%3e%3c/use%3e%3cuse xlink:href='%23MJMAIN-6E' x='6339' y='0'%3e%3c/use%3e%3cuse xlink:href='%23MJMAIN-74' x='6895' y='0'%3e%3c/use%3e%3cuse xlink:href='%23MJMAIN-72' x='7285' y='0'%3e%3c/use%3e%3cuse xlink:href='%23MJMAIN-61' x='7677' y='0'%3e%3c/use%3e%3cuse xlink:href='%23MJMAIN-74' x='8178' y='0'%3e%3c/use%3e%3cuse xlink:href='%23MJMAIN-69' x='8567' y='0'%3e%3c/use%3e%3cuse xlink:href='%23MJMAIN-6F' x='8846' y='0'%3e%3c/use%3e%3cuse xlink:href='%23MJMAIN-6E' x='9346' y='0'%3e%3c/use%3e%3c/g%3e%3c/g%3e%3cg transform='translate(7228%2c-686)'%3e%3cuse xlink:href='%23MJMAIN-4E'%3e%3c/use%3e%3cuse xlink:href='%23MJMAIN-6F' x='750' y='0'%3e%3c/use%3e%3cuse xlink:href='%23MJMAIN-6D' x='1251' y='0'%3e%3c/use%3e%3cuse xlink:href='%23MJMAIN-69' x='2084' y='0'%3e%3c/use%3e%3cuse xlink:href='%23MJMAIN-6E' x='2363' y='0'%3e%3c/use%3e%3cuse xlink:href='%23MJMAIN-61' x='2919' y='0'%3e%3c/use%3e%3cuse xlink:href='%23MJMAIN-6C' x='3420' y='0'%3e%3c/use%3e%3cuse xlink:href='%23MJMAIN-63' x='3948' y='0'%3e%3c/use%3e%3cuse xlink:href='%23MJMAIN-6F' x='4393' y='0'%3e%3c/use%3e%3cuse xlink:href='%23MJMAIN-6E' x='4893' y='0'%3e%3c/use%3e%3cuse xlink:href='%23MJMAIN-63' x='5450' y='0'%3e%3c/use%3e%3cuse xlink:href='%23MJMAIN-65' x='5894' y='0'%3e%3c/use%3e%3cuse xlink:href='%23MJMAIN-6E' x='6339' y='0'%3e%3c/use%3e%3cuse xlink:href='%23MJMAIN-74' x='6895' y='0'%3e%3c/use%3e%3cuse xlink:href='%23MJMAIN-72' x='7285' y='0'%3e%3c/use%3e%3cuse xlink:href='%23MJMAIN-61' x='7677' y='0'%3e%3c/use%3e%3cuse xlink:href='%23MJMAIN-74' x='8178' y='0'%3e%3c/use%3e%3cuse xlink:href='%23MJMAIN-69' x='8567' y='0'%3e%3c/use%3e%3cuse xlink:href='%23MJMAIN-6F' x='8846' y='0'%3e%3c/use%3e%3cuse xlink:href='%23MJMAIN-6E' x='9346' y='0'%3e%3c/use%3e%3c/g%3e%3c/g%3e%3c/g%3e%3cuse xlink:href='%23MJMAIN-D7' x='28593' y='0'%3e%3c/use%3e%3cg transform='translate(29594%2c0)'%3e%3cuse xlink:href='%23MJMAIN-31'%3e%3c/use%3e%3cuse xlink:href='%23MJMAIN-30' x='500' y='0'%3e%3c/use%3e%3cuse xlink:href='%23MJMAIN-30' x='1001' y='0'%3e%3c/use%3e%3c/g%3e%3c/g%3e%3c/g%3e%3c/g%3e%3c/g%3e%3c/svg%3e)
'%3e%3cg transform='translate(167%2c0)'%3e%3cg transform='translate(-13%2c0)'%3e%3cuse xlink:href='%23MJMAIN-43' x='0' y='0'%3e%3c/use%3e%3cuse xlink:href='%23MJMAIN-56' x='722' y='0'%3e%3c/use%3e%3cuse xlink:href='%23MJMAIN-25' x='1473' y='0'%3e%3c/use%3e%3cuse xlink:href='%23MJMAIN-3D' x='2584' y='0'%3e%3c/use%3e%3cg transform='translate(3640%2c0)'%3e%3cuse xlink:href='%23MJMAIN-31'%3e%3c/use%3e%3cuse xlink:href='%23MJMAIN-30' x='500' y='0'%3e%3c/use%3e%3cuse xlink:href='%23MJMAIN-30' x='1001' y='0'%3e%3c/use%3e%3c/g%3e%3cuse xlink:href='%23MJMAIN-D7' x='5364' y='0'%3e%3c/use%3e%3cg transform='translate(6365%2c0)'%3e%3cuse xlink:href='%23MJSZ3-28'%3e%3c/use%3e%3cg transform='translate(736%2c0)'%3e%3cg transform='translate(120%2c0)'%3e%3crect stroke='none' width='8620' height='60' x='0' y='220'%3e%3c/rect%3e%3cg transform='translate(60%2c676)'%3e%3cuse xlink:href='%23MJMAIN-53'%3e%3c/use%3e%3cuse xlink:href='%23MJMAIN-74' x='556' y='0'%3e%3c/use%3e%3cuse xlink:href='%23MJMAIN-61' x='946' y='0'%3e%3c/use%3e%3cuse xlink:href='%23MJMAIN-6E' x='1446' y='0'%3e%3c/use%3e%3cuse xlink:href='%23MJMAIN-64' x='2003' y='0'%3e%3c/use%3e%3cuse xlink:href='%23MJMAIN-61' x='2559' y='0'%3e%3c/use%3e%3cuse xlink:href='%23MJMAIN-72' x='3060' y='0'%3e%3c/use%3e%3cuse xlink:href='%23MJMAIN-64' x='3452' y='0'%3e%3c/use%3e%3cuse xlink:href='%23MJMAIN-44' x='4259' y='0'%3e%3c/use%3e%3cuse xlink:href='%23MJMAIN-65' x='5023' y='0'%3e%3c/use%3e%3cuse xlink:href='%23MJMAIN-76' x='5468' y='0'%3e%3c/use%3e%3cuse xlink:href='%23MJMAIN-69' x='5996' y='0'%3e%3c/use%3e%3cuse xlink:href='%23MJMAIN-61' x='6275' y='0'%3e%3c/use%3e%3cuse xlink:href='%23MJMAIN-74' x='6775' y='0'%3e%3c/use%3e%3cuse xlink:href='%23MJMAIN-69' x='7165' y='0'%3e%3c/use%3e%3cuse xlink:href='%23MJMAIN-6F' x='7443' y='0'%3e%3c/use%3e%3cuse xlink:href='%23MJMAIN-6E' x='7944' y='0'%3e%3c/use%3e%3c/g%3e%3cg transform='translate(3100%2c-686)'%3e%3cuse xlink:href='%23MJMAIN-4D'%3e%3c/use%3e%3cuse xlink:href='%23MJMAIN-65' x='917' y='0'%3e%3c/use%3e%3cuse xlink:href='%23MJMAIN-61' x='1362' y='0'%3e%3c/use%3e%3cuse xlink:href='%23MJMAIN-6E' x='1862' y='0'%3e%3c/use%3e%3c/g%3e%3c/g%3e%3c/g%3e%3cuse xlink:href='%23MJSZ3-29' x='9597' y='-1'%3e%3c/use%3e%3c/g%3e%3c/g%3e%3c/g%3e%3c/g%3e%3c/svg%3e)
Regulatory Alignment
These acceptance criteria are based on the latest regulatory standards for calibration curve validation in bioanalytical methods:
Key regulatory points:
-
All calibration standards must be evaluated by back-calculation.
-
Acceptance is based on bias and precision at each calibrator.
-
The reportable range is strictly defined by LLOQ and ULOQ.
-
Only results within the validated range are considered quantitative.
Practical Notes
-
You can adjust bias limits and minimum passing calibrators in the UI to match your protocol or regulatory submission.
-
The system automatically identifies and displays LLOQ and ULOQ.
-
All calculations and pass/fail logic are versioned and traceable for audit.
For more detail, see the referenced regulatory documents or your internal SOPs. If you have questions about how these criteria are applied in RARE, contact your QC or regulatory lead.
Fit Models, Fit Parameters, and Fit Quality
Below you’ll find a breakdown of each supported calibration model, including both forward prediction (signal from concentration) and back-calculation (concentration from signal), as well as guidance on interpreting fit quality.
Linear Regression
Linear regression is suitable for assays with a direct, proportional relationship between signal and concentration.
Forward Model
'%3e%3cg transform='translate(167%2c0)'%3e%3cg transform='translate(-13%2c0)'%3e%3cg transform='translate(0%2c-47)'%3e%3cuse xlink:href='%23MJMATHI-79' x='0' y='0'%3e%3c/use%3e%3cuse xlink:href='%23MJMAIN-3D' x='775' y='0'%3e%3c/use%3e%3cuse xlink:href='%23MJMATHI-6D' x='1831' y='0'%3e%3c/use%3e%3cuse xlink:href='%23MJMATHI-78' x='2710' y='0'%3e%3c/use%3e%3cuse xlink:href='%23MJMAIN-2B' x='3504' y='0'%3e%3c/use%3e%3cuse xlink:href='%23MJMATHI-62' x='4505' y='0'%3e%3c/use%3e%3c/g%3e%3c/g%3e%3c/g%3e%3c/g%3e%3c/svg%3e)
-
( y ): measured signal
-
( x ): known concentration
-
( m ): slope
-
( b ): intercept
Inverted (Back-Calculation) Model
'%3e%3cg transform='translate(167%2c0)'%3e%3cg transform='translate(-13%2c0)'%3e%3cg transform='translate(0%2c-95)'%3e%3cuse xlink:href='%23MJMATHI-78' x='0' y='0'%3e%3c/use%3e%3cuse xlink:href='%23MJMAIN-3D' x='850' y='0'%3e%3c/use%3e%3cg transform='translate(1628%2c0)'%3e%3cg transform='translate(397%2c0)'%3e%3crect stroke='none' width='2269' height='60' x='0' y='220'%3e%3c/rect%3e%3cg transform='translate(60%2c692)'%3e%3cuse xlink:href='%23MJMATHI-79' x='0' y='0'%3e%3c/use%3e%3cuse xlink:href='%23MJMAIN-2212' x='719' y='0'%3e%3c/use%3e%3cuse xlink:href='%23MJMATHI-62' x='1720' y='0'%3e%3c/use%3e%3c/g%3e%3cuse xlink:href='%23MJMATHI-6D' x='695' y='-686'%3e%3c/use%3e%3c/g%3e%3c/g%3e%3c/g%3e%3c/g%3e%3c/g%3e%3c/g%3e%3c/svg%3e)
Used to calculate the concentration from a measured signal.
4-Parameter Logistic (4PL)
The 4PL model is commonly used for sigmoidal dose-response curves in immunoassays.
Forward Model
'%3e%3cg transform='translate(167%2c0)'%3e%3cg transform='translate(-13%2c0)'%3e%3cg transform='translate(0%2c552)'%3e%3cuse xlink:href='%23MJMATHI-79' x='0' y='0'%3e%3c/use%3e%3cuse xlink:href='%23MJMAIN-3D' x='775' y='0'%3e%3c/use%3e%3cuse xlink:href='%23MJMATHI-44' x='1831' y='0'%3e%3c/use%3e%3cuse xlink:href='%23MJMAIN-2B' x='2882' y='0'%3e%3c/use%3e%3cg transform='translate(3660%2c0)'%3e%3cg transform='translate(342%2c0)'%3e%3crect stroke='none' width='4573' height='60' x='0' y='220'%3e%3c/rect%3e%3cg transform='translate(885%2c676)'%3e%3cuse xlink:href='%23MJMATHI-41' x='0' y='0'%3e%3c/use%3e%3cuse xlink:href='%23MJMAIN-2212' x='972' y='0'%3e%3c/use%3e%3cuse xlink:href='%23MJMATHI-44' x='1973' y='0'%3e%3c/use%3e%3c/g%3e%3cg transform='translate(60%2c-1348)'%3e%3cuse xlink:href='%23MJMAIN-31' x='0' y='0'%3e%3c/use%3e%3cuse xlink:href='%23MJMAIN-2B' x='722' y='0'%3e%3c/use%3e%3cg transform='translate(1723%2c0)'%3e%3cuse xlink:href='%23MJSZ2-28'%3e%3c/use%3e%3cg transform='translate(597%2c0)'%3e%3cg transform='translate(120%2c0)'%3e%3crect stroke='none' width='657' height='60' x='0' y='220'%3e%3c/rect%3e%3cuse transform='scale(0.707)' xlink:href='%23MJMATHI-78' x='178' y='605'%3e%3c/use%3e%3cuse transform='scale(0.707)' xlink:href='%23MJMATHI-43' x='84' y='-593'%3e%3c/use%3e%3c/g%3e%3c/g%3e%3cuse xlink:href='%23MJSZ2-29' x='1495' y='-1'%3e%3c/use%3e%3cuse transform='scale(0.707)' xlink:href='%23MJMATHI-42' x='2959' y='1240'%3e%3c/use%3e%3c/g%3e%3c/g%3e%3c/g%3e%3c/g%3e%3c/g%3e%3c/g%3e%3c/g%3e%3c/g%3e%3c/svg%3e)
-
( y ): measured signal
-
( x ): known concentration
-
( A ): response at zero concentration (lower asymptote)
-
( B ): response at infinite concentration (upper asymptote)
-
( C ): inflection point (EC50)
-
( D ): slope (Hill’s slope)
Inverted (Back-Calculation) Model
'%3e%3cg transform='translate(167%2c0)'%3e%3cg transform='translate(-13%2c0)'%3e%3cuse xlink:href='%23MJMATHI-78' x='0' y='0'%3e%3c/use%3e%3cuse xlink:href='%23MJMAIN-3D' x='850' y='0'%3e%3c/use%3e%3cuse xlink:href='%23MJMATHI-43' x='1906' y='0'%3e%3c/use%3e%3cg transform='translate(2833%2c0)'%3e%3cuse xlink:href='%23MJSZ4-5B'%3e%3c/use%3e%3cg transform='translate(583%2c0)'%3e%3cuse xlink:href='%23MJSZ3-28'%3e%3c/use%3e%3cg transform='translate(736%2c0)'%3e%3cg transform='translate(120%2c0)'%3e%3crect stroke='none' width='2921' height='60' x='0' y='220'%3e%3c/rect%3e%3cg transform='translate(60%2c676)'%3e%3cuse xlink:href='%23MJMATHI-41' x='0' y='0'%3e%3c/use%3e%3cuse xlink:href='%23MJMAIN-2212' x='972' y='0'%3e%3c/use%3e%3cuse xlink:href='%23MJMATHI-44' x='1973' y='0'%3e%3c/use%3e%3c/g%3e%3cg transform='translate(186%2c-686)'%3e%3cuse xlink:href='%23MJMATHI-79' x='0' y='0'%3e%3c/use%3e%3cuse xlink:href='%23MJMAIN-2212' x='719' y='0'%3e%3c/use%3e%3cuse xlink:href='%23MJMATHI-44' x='1720' y='0'%3e%3c/use%3e%3c/g%3e%3c/g%3e%3c/g%3e%3cuse xlink:href='%23MJMAIN-2212' x='4120' y='0'%3e%3c/use%3e%3cuse xlink:href='%23MJMAIN-31' x='5121' y='0'%3e%3c/use%3e%3cuse xlink:href='%23MJSZ3-29' x='5621' y='-1'%3e%3c/use%3e%3cg transform='translate(6358%2c1177)'%3e%3cuse transform='scale(0.707)' xlink:href='%23MJMAIN-31' x='0' y='0'%3e%3c/use%3e%3cuse transform='scale(0.707)' xlink:href='%23MJMAIN-2F' x='500' y='0'%3e%3c/use%3e%3cuse transform='scale(0.707)' xlink:href='%23MJMATHI-42' x='1001' y='0'%3e%3c/use%3e%3c/g%3e%3c/g%3e%3cuse xlink:href='%23MJSZ4-5D' x='8286' y='-1'%3e%3c/use%3e%3c/g%3e%3c/g%3e%3c/g%3e%3c/g%3e%3c/svg%3e)
Used to solve for concentration given a measured signal.
5-Parameter Logistic (5PL)
The 5PL model extends 4PL by adding an asymmetry parameter, allowing for more flexible curve fitting.
Forward Model
'%3e%3cg transform='translate(167%2c0)'%3e%3cg transform='translate(-13%2c0)'%3e%3cg transform='translate(0%2c851)'%3e%3cuse xlink:href='%23MJMATHI-79' x='0' y='0'%3e%3c/use%3e%3cuse xlink:href='%23MJMAIN-3D' x='775' y='0'%3e%3c/use%3e%3cuse xlink:href='%23MJMATHI-44' x='1831' y='0'%3e%3c/use%3e%3cuse xlink:href='%23MJMAIN-2B' x='2882' y='0'%3e%3c/use%3e%3cg transform='translate(3660%2c0)'%3e%3cg transform='translate(342%2c0)'%3e%3crect stroke='none' width='6270' height='60' x='0' y='220'%3e%3c/rect%3e%3cg transform='translate(1734%2c676)'%3e%3cuse xlink:href='%23MJMATHI-41' x='0' y='0'%3e%3c/use%3e%3cuse xlink:href='%23MJMAIN-2212' x='972' y='0'%3e%3c/use%3e%3cuse xlink:href='%23MJMATHI-44' x='1973' y='0'%3e%3c/use%3e%3c/g%3e%3cg transform='translate(60%2c-1646)'%3e%3cuse xlink:href='%23MJSZ3-5B'%3e%3c/use%3e%3cuse xlink:href='%23MJMAIN-31' x='528' y='0'%3e%3c/use%3e%3cuse xlink:href='%23MJMAIN-2B' x='1251' y='0'%3e%3c/use%3e%3cg transform='translate(2251%2c0)'%3e%3cuse xlink:href='%23MJSZ2-28'%3e%3c/use%3e%3cg transform='translate(597%2c0)'%3e%3cg transform='translate(120%2c0)'%3e%3crect stroke='none' width='657' height='60' x='0' y='220'%3e%3c/rect%3e%3cuse transform='scale(0.707)' xlink:href='%23MJMATHI-78' x='178' y='605'%3e%3c/use%3e%3cuse transform='scale(0.707)' xlink:href='%23MJMATHI-43' x='84' y='-593'%3e%3c/use%3e%3c/g%3e%3c/g%3e%3cuse xlink:href='%23MJSZ2-29' x='1495' y='-1'%3e%3c/use%3e%3cuse transform='scale(0.707)' xlink:href='%23MJMATHI-42' x='2959' y='1240'%3e%3c/use%3e%3c/g%3e%3cuse xlink:href='%23MJSZ3-5D' x='4981' y='-1'%3e%3c/use%3e%3cuse transform='scale(0.707)' xlink:href='%23MJMATHI-45' x='7792' y='1665'%3e%3c/use%3e%3c/g%3e%3c/g%3e%3c/g%3e%3c/g%3e%3c/g%3e%3c/g%3e%3c/g%3e%3c/svg%3e)
-
( y ): measured signal
-
( x ): known concentration
-
( A ): lower asymptote
-
( D ): upper asymptote
-
( C ): inflection point (EC50)
-
( B ): slope
-
( E ): asymmetry factor
Inverted (Back-Calculation) Model
'%3e%3cg transform='translate(167%2c0)'%3e%3cg transform='translate(-13%2c0)'%3e%3cuse xlink:href='%23MJMATHI-78' x='0' y='0'%3e%3c/use%3e%3cuse xlink:href='%23MJMAIN-3D' x='850' y='0'%3e%3c/use%3e%3cuse xlink:href='%23MJMATHI-43' x='1906' y='0'%3e%3c/use%3e%3cg transform='translate(2833%2c0)'%3e%3cg transform='translate(0%2c2008)'%3e%3cuse xlink:href='%23MJSZ4-239B' x='0' y='-1156'%3e%3c/use%3e%3cuse xlink:href='%23MJSZ4-239D' x='0' y='-2873'%3e%3c/use%3e%3c/g%3e%3cg transform='translate(875%2c0)'%3e%3cuse xlink:href='%23MJSZ4-5B'%3e%3c/use%3e%3cg transform='translate(583%2c0)'%3e%3cuse xlink:href='%23MJSZ3-28'%3e%3c/use%3e%3cg transform='translate(736%2c0)'%3e%3cg transform='translate(120%2c0)'%3e%3crect stroke='none' width='2921' height='60' x='0' y='220'%3e%3c/rect%3e%3cg transform='translate(60%2c676)'%3e%3cuse xlink:href='%23MJMATHI-41' x='0' y='0'%3e%3c/use%3e%3cuse xlink:href='%23MJMAIN-2212' x='972' y='0'%3e%3c/use%3e%3cuse xlink:href='%23MJMATHI-44' x='1973' y='0'%3e%3c/use%3e%3c/g%3e%3cg transform='translate(186%2c-686)'%3e%3cuse xlink:href='%23MJMATHI-79' x='0' y='0'%3e%3c/use%3e%3cuse xlink:href='%23MJMAIN-2212' x='719' y='0'%3e%3c/use%3e%3cuse xlink:href='%23MJMATHI-44' x='1720' y='0'%3e%3c/use%3e%3c/g%3e%3c/g%3e%3c/g%3e%3cuse xlink:href='%23MJSZ3-29' x='3898' y='-1'%3e%3c/use%3e%3cg transform='translate(4634%2c1177)'%3e%3cuse transform='scale(0.707)' xlink:href='%23MJMAIN-31' x='0' y='0'%3e%3c/use%3e%3cuse transform='scale(0.707)' xlink:href='%23MJMAIN-2F' x='500' y='0'%3e%3c/use%3e%3cuse transform='scale(0.707)' xlink:href='%23MJMATHI-45' x='1001' y='0'%3e%3c/use%3e%3c/g%3e%3c/g%3e%3cuse xlink:href='%23MJMAIN-2212' x='6789' y='0'%3e%3c/use%3e%3cuse xlink:href='%23MJMAIN-31' x='7789' y='0'%3e%3c/use%3e%3cuse xlink:href='%23MJSZ4-5D' x='8290' y='-1'%3e%3c/use%3e%3cg transform='translate(8873%2c1477)'%3e%3cuse transform='scale(0.707)' xlink:href='%23MJMAIN-31' x='0' y='0'%3e%3c/use%3e%3cuse transform='scale(0.707)' xlink:href='%23MJMAIN-2F' x='500' y='0'%3e%3c/use%3e%3cuse transform='scale(0.707)' xlink:href='%23MJMATHI-42' x='1001' y='0'%3e%3c/use%3e%3c/g%3e%3c/g%3e%3cg transform='translate(11094%2c2008)'%3e%3cuse xlink:href='%23MJSZ4-239E' x='0' y='-1155'%3e%3c/use%3e%3cuse xlink:href='%23MJSZ4-23A0' x='0' y='-2873'%3e%3c/use%3e%3c/g%3e%3c/g%3e%3c/g%3e%3c/g%3e%3c/g%3e%3c/svg%3e)
Used to solve for concentration from a measured signal.
Fit Quality
For all models, RARE provides:
-
R² (coefficient of determination): Indicates goodness of fit.
-
RMSE (Root Mean Square Error): Measures average error between predicted and actual values.
-
Bias and Precision at each calibrator: Calculated for each calibrator using back-calculation, shown as % difference between predicted and true concentration.
-
Acceptance Criteria: Defaults are 15% bias (standard), 20% (LLOQ/ULOQ), 75% minimum passing calibrators.
-
Visual Outputs: Overlay of fitted curve and data points.
Acceptance criteria and reportable range (LLOQ/ULOQ) are automatically evaluated and displayed for each fit.
Always review fit quality metrics before enabling a batch.
Troubleshooting